|
Archives 12/30/01, 1/1/02, 1/2/02, 1/3/02, 1/4/02, 1/7/02, 1/8/02, 1/09/02, 1/10/02, 1/11/02, 1/14/02, 1/15/02, 1/16/02, 1/17/02, 1/18/02, 1/22/02, 1/23/02, 1/24/02, 1/25/02, 1/28/02, 1/29/02, 1/30/02, 1/31/02, 2/1/02, 2/4/02, 2/5/02, 2/06/02, 2/7/02, 2/9/02, 2/11/02, 2/12/02, 2/13/02, 2/14/02, 2/16/02, 2/19/02, 2/20/02, 2/21/02, 2/23/02, 2/25/02, 2/26/02, 2/27/02, 2/28/02, 3/1/02, 3/04/02, 3/05/02, 3/06/02, 3/7/02, 3/10/02,3/11/02, 3/12/02, 3/13/02, 3/14/02, 3/15/02, 3/18/02, 3/19/02, 3/20/02, 3/21/02, 3/22/02, 3/25/02, 3/26/02, 3/28/02, 3/30/02 4/1/02, 4/2/02, 4/3/02, 4/4/02, 4/6/02, 4/8/02, 4/9/02, 4/10/02, 4/11/02, 4/13/02, 4/15/02, 4/16/02, 4/17/02, 4/18/02, 4/20/02, 4/22/02, 4/23/02,4/24/02,4/25/02, 4/26/02, 4/27/02, 4/29/02, 4/30/02 5/01/02, 5/2/02, 5/4/02, 5/6/02, 5/07/02, 5/8/02, 5/09/02, 5/10/02, 5/13/02, 5/14/02, 5/15/02, 5/16/02, 5/17/02, 5/20/02, 5/21/02, 5/22/02, 5/23/02, 5/24/02, 5/28/02, 5/29/02, 5/30/02 6/01/02, 6/3/02, 6/4/02, 6/5/02, 6/6/02, 6/7/02, 6/10/02, 6/11/02, 6/12/02, 6/13/02, 6/14/02, 6/17/02, 6/18/02, 6/19/02, 6/20/02, 6/22/02, 6/24/02, 6/25/02, 6/26/02, 6/27/02, 6/30/02 7/1/02, 7/4/02, 7/5/02, 7/11/02, 7/14/02, 7/15/02, 7/16/02, 7/17/02, 7/18/02, 7/19/02, 7/22/02, 7/23/02, 7/24/02, 7/25/02, 7/27/02, 7/29/02, 7/30/02 8/1/02, 8/3/02, 8/5/02, 8/6/02, 8/7/02, 8/8/02, 8/10/02, 8/12/02, 8/13/02, 8/14/02, 8/15/02, 8/16/02, 8/19/02, 8/20/02, 8/21/02, 8/22/02, 8/23/02, 8/26/02, 8/27/02, 8/28/02, 8/29/02, 8/30/02 9/3/02, 9/4/02, 9/5/02. 9/6/02, 9/9/02, 9/10/02, 9/11/02, 9/12/02, 9/13/02, 9/16/02, 9/17/02, 9/18/02, 9/19/02, 9/20/02, 9/23/02, 9/24/02, 9/25/02, 9/26/02, 9/27/02, 9/30/02 10/1/02, 10/2/02, 10/3/02, 10/4/02, 10/7/02, 10/8/02, 10/9/02, 10/10/02, 10/11/02, 10/14/02, 10/15/02, 10/16/02, 10/17/02, 10/18/02, 10/21/02, 10/22/02, 10/23/02, 10/24/02, 10/25/02, 10/28/02, 10/29/02, 10/30/02, 10/31/02 11/1/02, 11/4/02, 11/5/02, 11/6/02, 11/7/02, 11/8/02, 11/11/02, 11/12/02, 11/13/02, 11/14/02, 11/15/02, 11/18/02, 11/19/02, 11/20/02, 11/21/02, 11/22/02, 11/25/02, 11/26/02, 11/27/02, 11/29/02 12/2/02,
12/3/02, 12/4/02,
12/5/02 1/1/03, 1/2/03, 1/03/03, 1/6/03, 1/7/03, 1/8/03, 1/9/03, 1/10/03, 1/13/03, 1/14/03, 1/15/03, 1/16/03, 1/17/03, 1/21/03, 1/22/03, 1/23/03, 1/24/03, 1/27/03, 1/28/03
 Doc's view of the Street. |
The Anals of Stock ProctologyPublished weeknights by
8:30PM Happy Acres, Florida Time The American
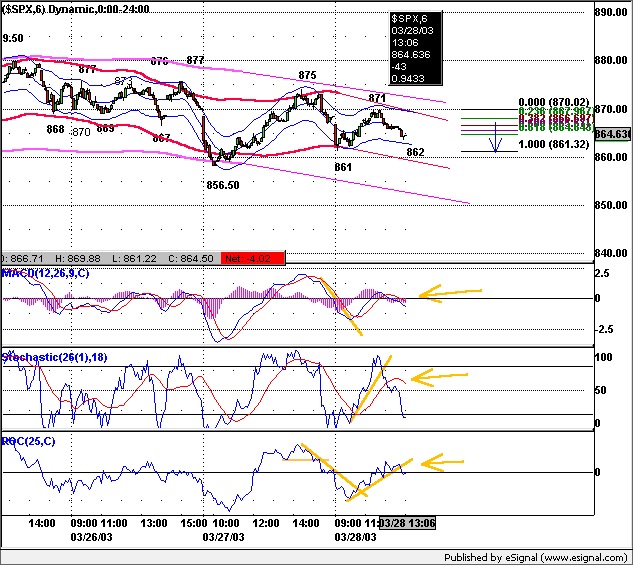
Academy of Stock Proctology and Is your subscription up for renewal? If you want to renew, do nothing, unless your credit card has expired. Please be sure your credit card info is current. If your credit card has expired, you must enter the new expiration date in your Paypal account in order for your subscription to be processed. If you subscribed via Paypal, your subscription will be renewed for one year on the 90 day anniversary of your sign-up and your credit card will be charged. If you want to cancel, use the button at the bottom of the page. This applies only if you subscribed through Paypal. Mailed-in subscriptions are for 1 year. If you subscribed by prior contribution, I will send you a notice before your subscription expires. If you have any questions, see the subscription page and FAQ's. If you can't find the answer, email me. Big Fine Print Doc does not make trading recommendations. This update reports time cycle estimates and centered moving average projections based on the Hurst cycle analysis method, and other techniques. This publication is for entertainment and educational purposes only. Doc assumes no responsibility for the accuracy or inaccuracy of the estimates and projections presented. The market may or may not meet the projections. Stoolies should thoroughly familiarize themselves with the methodology before trading based on this method. Those who do not have the time or inclination to develop a trading strategy based on testing and research should not trade. Trade at your own risk. Yadda yadda. How's your motha? More disclaimers at the bottom of the page. Doc welcomes the many new junior stock proctologists who have joined the American Society of Shortsellers in the past week. If you are not an experienced chartist or trader, ok, even if you are, you may find the Anals just a bit confusing for a little while. But Fear Not! You will get it after a few days, at most a couple of weeks. Questions can always be posted on the Stool Pigeons Wire message boards, where Doc and/or your fellow stoolies will respond. Explanations of abbreviations and terms are at the bottom of the page. The complete list of links to the entire archive is in the left column menu. Now it's time to sit back, relax, and enjoy the show. Many tanks! Doc Intraday Update 12:45 PM 1/31/03 One day cycle lows were established in the first hour near the cmaps. High should be forming as of 1 PM, as cmaps are being hit and time is right. The caveat would be if the rally lasts beyond 2 PM, and exceeds the cmap. I don't expect this, but am open to revising the 3-8 day cycle projections up a bit if it happens. More likely expect weakness in the later PM. Chart below. Join Doc for regular updates in Stooltrading beta. Intraday Turdsday - Stock prices fell at the open, turned and retested the opening highs, then sold off into a 5 hour cycle low around 12:00. They swupped for about two hours, then sold off again. Look for a 5 hour - 1 day cycle low between 10:30 and 12:00 tomorrow, then a swup into mid afternoon. The 8 day cycle turned down, and the market is resting at a shport level. It could get ugly in the PM. Pre Market Update at 9:15 AM NY time. Get StoolieSignal Special offer here only! The cycle map below is en estimate of how the market might behave over the next few hours. Should the pattern be broken, the map should be redrawn to fit the actual. Cmaps and times shown are guidelines only. Cycles vary in wavelength and amplitude. Directional changes within an hour of the expected turn and a few points of the cmap should be respected. The indicators rule. Times and prices are the projected cycle highs and lows with cmaps. 5-8 Day Cycle______ 2-3 Day Cycle_______ 5 Hr-1 Day Cycle
Turdsday's
Markets Fed Releases Turdsday 1/30/03 It's time for our weekly review of those nice little monetary data pictures released by the Fed every Turdsday night. Some of the data is through yesterday, however most is 10 days stale. Keep that in mind as you relate the charts to what you know the Feed has been doing right up to the minute. First let's reprise the MoGauge from last night, since it's the source of 87% of the liquidity in the market. 86% is an estimate based on the % of M3 to total money supply. M1, the portion of the money supply most directly impacted by the Feed, now represents only 14%. In other words, it is the GSE's most responsible for creating systemic liquidity. The Fed can grease the skids, but if mortgage loan demand wanes, system wide liquidity will begin to shrink. We expect monetary measures to lag the MoGauge by a couple of months, because that is typically how long it takes to fund a mortgage application and put the loan in Fannie or Freddie's portfolio, where it becomes money through the magic of money market fund intermediation. Mortgage applications get funded about 4-8 weeks
after the application is taken. When the GSE's hold those loans in their
portfolios, they then turn into money through the magic of money market fund
intermediation. Broad money supply grows, and
that flows into the markets and economic activity. Likewise, when mortgage
activity declines, money growth slows or even goes negative. In effect, the MoGauge
has the potential of telling us to what degree money will be added to the
system in a month or so. Big jumps in the MoGauge tend to be followed by big stock
market rallies along with big jumps in money supply. When these bulges
subside, the market follows a month or two later. The faltering MoGauge has indeed
led to a halt in the growth of broader measures of money. M2, which is
somewhat narrower, did spike up in the week ended 1/20. That was during a
week of gigantic Feed. M3 (not shown) and MZM also rose, but remained
below their recent levels. The uptick in M1 that week can also
be related to maniacal Feeding. Overall, M1 has barely grown at all in a
year. How is it that over this time, Feed, which is the Fed's total
holdings of loans and securities, has grown by nearly 6% and M1 has grown
by only 3%. And checking accounts are actually DOWN! Isn't there supposed
to be a multiplier effect? Pipe must'a sprung a leak somewhere. The
leak is called default and bankruptcy. Then there's the seepage we don't
know about in the great game of dodge the derivative counterparty
liability, and off balance sheet liabilities. Total bank credit is showing
ominous signs of shrinkage in the month prior to January 15. What's that
crunch sound? Commercial lending is in a
depression. The cp market is equally bad.
This data is through yesterday. Stoolies, let's face it. The much reported reliquefaction just ain't happening. Dollars are being destroyed as fast as the Fed can create. They are creating at a 6% rate, down from 10% a year ago, and monetary measures are lagging that as credit demand weakens among the stronger credits, while the weaker ones are lined up with no place to go as lenders do the Archie Bell and Tighten Up. Perhaps this is another reason why Al has pulled back so dramatically on the Feed pump in recent days. It's not working, but it is creating inflationary expectations. The slumping dollar is exacerbating the problem as investors flee US paper assets, and US bank accounts! Surely, Al will pump hard again when the markets go into crisis mode. But with signs of inflation heating up, any spike in M1 as a result of massive Feeding is likely to draw unwelcome attention in the bond pits. That's where the time bomb is ticking. Department of Yes We Have No Inflation
Doc's Pooper Scooper. Be a Johnny Applestool! Help spread the Stool! Feel free to repost snippets from the Anals on message boards around the web. Just give a link back! Many tanks - Doc The Feed added a net of $2.5 billion. They did $4 billion in overnight repos while $1.5 billion expired. They also rolled over $3 billion in the usual Turdsday round of 28 day repos. The $4 billion will expire Friday. Yesterday Doc speculated that the rally in the face of tight Feed would give Al some breathing room to Feed more. And so he did. The market may not be predictable, but Al is. Feeds this small are a non-issue, and merely reversed the prior day's drain. The Feed Index is marking time, remaining unchanged over the last two months. Without Feed growth the stock market will founder, but Al is apparently focused on stabilizing the dollar and keeping long term interest rates stable. Two
trends are evident on the Feed Index, which is the total Fed holdings of
loans and securities. One is the 10% growth trend beginning in May of
2001. The blue channel going back to last December suggests a 5% growth rate. Look at the 4 week moving
average (brown line) and compare it with the slope of the tow larger
channels for an indication for whether the slope of short term growth is
slower or faster than the 2 longer term trends. The Feedometer remains in a short term downtrend. Doc said after the rally Wednesday that without an uptrend in the Feedometer, indicating the creation of excess Feed for jamming the markets, stock rallies will not stick. The liquidity isn't there. Institutions have too little cash, and foreign investment is net negative. It's more Feed or else. Turdsday's market was proof of that. The
Feedometer theoretically measures excess Feed available for bond or stock
market jamming. Al selects a trend level he feels is needed to reflatulate
the economy. The Feedometer measures the difference between the apparent
trend target, and actual day to day Feeding (Fastow Feedometer), as well
as a four week moving average (Slowmo Feedometer). A break above the
orange trendline might indicate a more aggressive jamming policy.
Bond yields fell slightly. Yields are locked dead center in a
three month trading range in what Doc believes is a giant secular top in the bond
market price wise. Yields hit
long term downside cmaps in October, and the next major move will be up,
but there's still no sign that it's imminent. Virtually all short
and intermediate indicators are neutral. I guess we won't know until
it actually starts. The time is coming. Dow Inflatables- The
Dow's 6-7 week cycle oscillator dropped to 7450. That's probably a worst case.
There are still a couple of weeks to go in that cycle so it's not out
of the question. Cmaps continue to adjust until the point of infartation is
passed. In the meantime, we may see a bit of a bounce off a four week cycle
low due within a couple of days from around 7850. It could also blow right
through that. The 4 week cycle is usually a non-event when the steam roller gets
going downhill. All of Doc's daily cycle charts
are powered by METASTOCK Portfolio Sphincters Index (SPX) and Sentiment Cycle Chart Short Term Cycles The short cycle oscillator continued to rise as the market swooned. This is the norm when bigger cycles are turning lower. The first short cycle oscillator upturn results in a one or two day bounce, then the market heads lower again while the indicator diverges. That's where we are now. The process can continue for many days. Normally the market drifts haltingly lower, then accelerates down after the oscillator has corrected up toward the center line. The 4 and 6-7 week cycles continue lower. A low is due on the 4 week cycle in a few days, and the 6-7 week cycle in a few weeks. The 17 day rate of change dropped sharply, suggesting an acceleration in the downtrend. The downside cmap on the 4-7 week cycles is now 820-830, subject to adjustment each day until the low is behind us. That cmap is almost certain to move lower before the 6-7 week cycle ends. As long as it keeps dropping, we will follow where no man has tread before. Of course, it may not turn until slightly after the bottom, but who cares. Lest we forget, it gave us a loud and clear sell signal two weeks ago when the SPX was around 920. Missing a few points at the turn should not matter. 10-13 Week Cycle The 10-13 week cycle oscillators are heading down too. They started late but there is a lot of time left in this cycle, as much as 9 weeks, and at least 6. The 29 day rate of change is moving ever so gradually lower. We could see a drip drip bounce, drip drip bounce, for weeks. The preliminary cmap is now 810, but look for that to go lower, especially as the cycle gets into its last few weeks. The next week or two should continue to be choppy, at least until the halfway point of the cycle is past in mid February. Until then the dip knee jerks will still poke their heads out of their holes and pick bottoms every few days. Sentiment VIX rose. (down on the inverted scale chart). The touch of the lower channel Monday coincided with a short cycle low. Over the next few weeks the channels will turn lower and we should see much bigger numbers on VIX. The next big intermediate cycle low should see at least 50-60.
The 15 day rate of change is a proxy for the
4-7 week cycle. The 29 day rate of change is a proxy for the 10-13 week
cycle. The dark blue overlaid line is the 10-13 week cycle
oscillator, while the red line is the 6-7 week cycle oscillator. The VIX
is a measure of implied options volatility reflecting relative fear or
complacency. It is plotted below on an inverse scale to better show the
relationship to the price chart. The "Stool Bands" may reflect
either 6 month or 10-12 month cycles. The Cycle Conditions tables include cycle phase and a wild guess as to number of periods to the next turn, in days for the shortest cycles, weeks (W) or months (M) for the longer ones. This is a fluid exercise, in other words, the projections are likely to be wrong, but they force us to be vigilant for key turning points, and frequently work well enough to prevent costly misreadings. SPX Cycle Conditions as of 1/30/03
PTT - Periods Till Turn Nasgap Charts The Nas is expected to behave more like the SPX with the continued de-weighting of tech. In the interest of publishing the Anals earlier in the evening Doc is presenting the charts and data without commentary, as it is largely redundant relative to the SPX commentary above. Cycle Chart Nasdaq Cycle Conditions as of 1/29/03
PTT
- Periods Till Turn Suctor Watch and Stoolwethers- Now posted on separate page. Updated each morning between 8 AM and 9:00 AM NY time. Long Bong Hit - See top of page. Golden Stool Comments 1/30/03 PM Gold and Cousin HUI
upticked after getting whacked Wednesday. HUI remains in a 10-13 week
cycle sideways down phase which should end within a few days, but may
extend into mid February. The downside
cmap is 141. We need to keep an eye on the 17 day rate of change. If it
drops from here, HUI will have a sharper pullback to complete the consolidation.
If it turns up from neutral levels where it is now, HUI will take off like
a rocket. Gold hit its upside 10-13 week cmap of
371 a few days ago. Its 6 month cycle cmap is 380 and one year cycle cmap is
400. HUI's 6 month cycle cmap has dropped to 166, and the 1 year cmap
is 195. These targets will continue to adjust until the turns arrive. Doc
expects to see 200 by June or July.
Uncle Buck's Illness Comments1/29/03 PM Uncle Buck was
up slightly Turdsday, continuing a short cycle swup. Most of that gain
came on a morning jam which he spent the afternoon giving back. Short cycle cmaps still point to around
98-98.50 but the short cycle oscillator has turned up suggesting a brief
sideways up phase. The 10-13 week cycle has upticked to 98.50 with
the 6 month cycle
cmap at 93.50. The 10-13 week cycle could swup here for a few weeks.
Nothing dramatic. Then down the tubes again. Chart as of 1/30/03 close Get StoolieSignal Special offer here only! Suctor Watch and Stoolwethers- Now posted on separate page. Updated each morning between 8 AM and 9:00 AM NY time. See you in Intraday Stool. Dr. Stepan N. Stool Share your thoughts on the Stool Pigeons Wire.
Renewals Thank you for subscribing to the Anals of Stock Proctology. Your trial subscription will run for 90 days. At the end of that period your subscription will renew automatically, unless you cancel. If you wish to cancel your subscription use the button below. If you want to renew your subscription do nothing. Your subscription will renew and your credit card or Paypal bank account will be charged. If you want to renew, be sure your credit card information in your Paypal account is current. Paypal will not renew your subscription if the card has expired!
Explanation of Intraday Commentary-Build charts at http://www.livecharts.com. For custom time bars insert a comma after symbol and number of minutes, e.g. compx,90. This will give you a bar chart of the Nas with 90 minutes per bar. The one day cycle is usually most clear with 8 minute bars and 26/18 stochastics. It varies from day to day. Sometimes 6 minutes works best. Experiment to find the best fit for your trading style, and the market's dominant frequency at the time. The goal here is primarily to monitor the condition of the 8 and 13 day cycles. I typically use 90 minute bars with 26/18 stochastics for the 13 day cycle proxy on the indices during regular trading hours. Other cycles use 26/18 stochastics with the following: 8 days- 60 minute bars On the 24 hour futures charts, use a time per bar approximately 3 to 4 times the above number of minutes, to represent the cycles listed above. About centered moving average projections. ABBREVIATIONS: cma: centered moving average |


![[Most Recent HUI from www.kitco.com]](http://www.weblinks247.com/indexes/idx24_hui_en_2.gif)
![[Most Recent XAU from www.kitco.com]](http://www.weblinks247.com/indexes/idx24_sp500_en_2.gif)
![[Most Recent Quotes from www.kitco.com]](http://kitconet.com/charts/metals/gold/t24_au_en_usoz_2.gif)