|
Archives 12/30/01, 1/1/02, 1/2/02, 1/3/02, 1/4/02, 1/7/02, 1/8/02, 1/09/02, 1/10/02, 1/11/02, 1/14/02, 1/15/02, 1/16/02, 1/17/02, 1/18/02, 1/22/02, 1/23/02, 1/24/02, 1/25/02, 1/28/02, 1/29/02, 1/30/02, 1/31/02, 2/1/02, 2/4/02, 2/5/02, 2/06/02, 2/7/02, 2/9/02, 2/11/02, 2/12/02, 2/13/02, 2/14/02, 2/16/02, 2/19/02, 2/20/02, 2/21/02, 2/23/02, 2/25/02, 2/26/02, 2/27/02, 2/28/02, 3/1/02, 3/04/02, 3/05/02, 3/06/02, 3/7/02, 3/10/02,3/11/02, 3/12/02, 3/13/02, 3/14/02, 3/15/02, 3/18/02, 3/19/02, 3/20/02, 3/21/02, 3/22/02, 3/25/02, 3/26/02, 3/28/02, 3/30/02 4/1/02, 4/2/02, 4/3/02, 4/4/02, 4/6/02, 4/8/02, 4/9/02, 4/10/02, 4/11/02, 4/13/02, 4/15/02, 4/16/02, 4/17/02, 4/18/02, 4/20/02, 4/22/02, 4/23/02,4/24/02,4/25/02, 4/26/02, 4/27/02, 4/29/02, 4/30/02 5/01/02, 5/2/02, 5/4/02, 5/6/02, 5/07/02, 5/8/02, 5/09/02, 5/10/02, 5/13/02, 5/14/02, 5/15/02, 5/16/02, 5/17/02, 5/20/02, 5/21/02, 5/22/02, 5/23/02, 5/24/02, 5/28/02, 5/29/02, 5/30/02 6/01/02, 6/3/02, 6/4/02, 6/5/02, 6/6/02, 6/7/02, 6/10/02, 6/11/02, 6/12/02, 6/13/02, 6/14/02, 6/17/02, 6/18/02, 6/19/02, 6/20/02, 6/22/02, 6/24/02, 6/25/02, 6/26/02, 6/27/02, 6/30/02 7/1/02, 7/4/02, 7/5/02, 7/11/02, 7/14/02, 7/15/02, 7/16/02, 7/17/02, 7/18/02, 7/19/02, 7/22/02, 7/23/02, 7/24/02, 7/25/02, 7/27/02, 7/29/02, 7/30/02 8/1/02, 8/3/02, 8/5/02, 8/6/02, 8/7/02, 8/8/02, 8/10/02, 8/12/02, 8/13/02, 8/14/02, 8/15/02, 8/16/02, 8/19/02, 8/20/02, 8/21/02, 8/22/02, 8/23/02, 8/26/02
|
The Anals of Stock ProctologyPublished weeknights by
8:30PM Happy Acres, Florida Time The American Academy of Stock Proctology and Is your subscription up for renewal? If you want to renew, do nothing, unless your credit card has expired. Please be sure your credit card info is current. If your credit card has expired, you must enter the new expiration date in your Paypal account in order for your subscription to be processed. If you subscribed via Paypal, your subscription will be renewed for one year on the 90 day anniversary of your sign-up and your credit card will be charged. If you want to cancel, use the button at the bottom of the page. This applies only if you subscribed through Paypal. Mailed-in subscriptions are for 1 year. If you subscribed by prior contribution, I will send you a notice before your subscription expires. If you have any questions, see the subscription page and FAQ's. If you can't find the answer, email me. Update 8/28/02 1:45 PM Terms and methodology The market took longer than projected to make a one day cycle low, which was finally put in at 12:30.What time the high will come is anyone's guess. It might be imminent or the market may drift for the rest of the day. Cmaps so far suggest there is little upside. The same is true of the 8 day cycle. We have an idea of where, but when could be any time between now and Monday.
Update 8/28/02 9:15 AM Terms and methodology Are you hearing the Jaws theme like Doc is? The fucutures sharks are swimming around out there, ready to strike on the open. Of course they misled us yesterday, and Doc had to take a mulligan. In spite of that, we have no choice but to rely on what they are telling us. The 5 hour low is overdue. We'll look for that just after the open, then a 1 day cycle low around 10:30. As discussed last night, we're seeing some shifting in the 8 and 13 day cycles, which makes guessing the timing for the low in that cycle problematic. Doc prefers to focus on price in this case. Doc does not make trading recommendations. This update reports intraday time cycle estimates and centered moving average projections based on the Hurst cycle analysis method. Doc assumes no responsibility for the accuracy or inaccuracy of these estimates and projections. The market may or may not meet these projections. New stoolies should thoroughly familiarize themselves with the methodology before trading based on this method. There is no free lunch. Those who do not have the time or inclination to develop a trading strategy based on testing and research should not trade. Trade at your own risk.
All News is Bad News (8/27/02) Doc watched bemusedly tonight as Sue Herass interviewed a couple of egonomists about today's economic data. As always, they tried to divine from this month-old stuff just what the market might do in the future. This is like watching a panel discussion of archaeologists on the subject of ancient Mesopotamian ruins, and their impact on architectural design in Las Vegas. OK, so maybe there is a connection in there somewhere, but why the hell are we talking about it? What a waste. And when exactly was the last time they had anyone on the boob tube discussing the destructive potential of 10-20% growth in M3, and the continuing expansion of the greatest credit bubble in history? In fact, why is it that nothing they talk about is relevant, and they never talk about what is. Or is that just Doc's usual paranoia? Aside from that, the terrible bond market performance today, without a rally in stocks, is a real bad sign, and one which may point to the beginning of an "all news is bad" phase. On the one hand, good news will be interpreted as leading to higher interest rates, and bad news will be interpreted as double dip, or profitless recovery, in other words, stagflation, the stock market's Public Enema Number 1. Just the kind of things bears love. A number of stoolies have worried that a bad band market will lead to more portfolio switching into stocks. Doc doubts that. Instead he thinks the money will just want to get the hell outta Dodge, and get back home to Tokyo, Riyadh, and Frankfurt. The Feed added $2.25 billion in overnight repos. There were no expirations. These repos will be the only rollover for Wednesday. Al seems to be hanging right
around that 10% growth lower limit for the total Feed, and is still in the
lower half of his go, no-go box. After Tuesday's abysmal market
performance, in particular the fact that even with the stock selloff,
bonds got trashed, be prepared for a really big shoe, as Ed Sullivan would
say. Big Feed in the morning, short sellers warning. Cover and out by 2
PM. We know they'll be buying. the only question is how much. Of course a
big Feed also has the potential to depress Uncle Buck and further spook
bond traders, who might just sell more than the Feed Gang buys. In the
end, intervention won't work. The Feedometer
upticked slightly. Again we need to be aware of the danger of a Feeding
frenzy. This thing is still in the up phase 6 month cycle. If they don't
want bonds, they may put it all into stocks. Again, keep your eye on those
announcements tomorrow. Anything more than $3 or $4 billion, especially if
more than overnight in duration, will set up a jam job in the afternoon
and Thursday. Not saying it will happen, but it can't hurt to pay
attention.
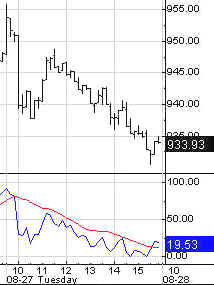
Portfolio Sphincters Index (SPX) and Sentiment
The VIX rose to 32.73. On the inverted scale chart it again dropped out of the top zone of the Stool Band. The final peak in this rally will probably not occur until the VIX and the upper blue band touch. That could happen by the VIX moving to touch the channel projection, or retroactively as the channel changes direction. Doc still thinks the index will need to get under 30, but does not place primary emphasis on this indicator. Price indicators always take precedence. There are no magic bullet sentiment indicators, and they are more likely to distract you from the task at hand. The
superimposed 6-7 week cycle (red line) oscillator fell again. So
far, it's been a sideways down phase, but that could change. The 10-13 week oscillator is still heading
up, but it has that suspended at the top look. The 17 day rate
of change, which is a proxy for the 6-7 week cycle, is on a sell signal
suggesting that the top may be under way, but the 29 day rate of change
(10-13 week cycle) isn't quite there. Until the 29 day ROC and the 10-13 week cycle oscillator
turn lower, it's safest to assume the up phase isn't over. The best
time to be short is when these indicators are in gear to the downside. Better
yet when they are in gear with the 6 month cycle indications. The 6 and 10-12 month oscillators are rising. That only tells us that these cycles are in an up phase. It does not tell us the strength of the phase, nor how long it will last. So far, its stronger than the rally last October in that it has covered more ground in the same period. The stoolicator also indicates a strong uptrend that has yet to peak. If this market is topping out, there is likely to be some bouncing around in the process. A runaway downside with the indicators in this posture isn't likely. The short cycle oscillator is now coming down hard. In itself, that's not significant, other than to confirm that shorter cycles are headed down. This still must be considered a counter cyclical move relative to the 6 month cycle, although it may be the beginning of the 10-13 week cycle top. By one count, the 10-13 week cycle high could be under way, with a cmap of 960 already hit. An alternative projection puts it 4 weeks out, at 1000. That is beginning to feel unlikely. As you know, in addition to empirical observation, the sense of feel is very important to the stock proctologist. This is often referred to as the peristalsis tic remote viewer. Ouch. The 6-7 week cycle has turned
down. The 4 week
cycle appears to be in a down phase now as well.
The 8 and 13 day cycles were due for a low, but it's not clear that the
down phases are finished. There's a cmap of 920 as a possible target for
the 13 day cycle and 900 on the 4 week cycle. Fiber Nacho Dump- First
stop 935, Naturally. What did you expect? There are scientific reasons for
this. We just don't know what the hell they are. Wednesday or Thursday the
decline will stop at 915, you just watch! This stuff drives Doc crazy
because it's not part of cyclical analysis, and he has no idea why it
works so often. The Cycle Conditions tables include cycle phase and a wild guess as to number of periods to the next turn, in days for the shortest cycles, weeks (W) or months (M) for the longer ones. This is a fluid exercise, in other words, the projections are likely to be wrong, but they force us to be vigilant for key turning points, and frequently work well enough to prevent costly misreadings. SPX Cycle Conditions as of 8/27/02
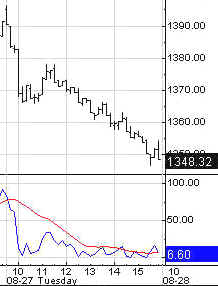
PTT - Periods Till Turn Nasgap Charts Rate of change indicators for the 6-7 and 10-13 week cycles were still mixed, and their trend is still up, but the 29 day ROC is hanging on by the skin of its teeth. The stoolicator has reached the level where it topped out in March. This bears watching. The 6 month cycle oscillator rose again and is in positive territory. That merely confirms that the 6 month cycle is in an up phase, but so far, its slope is only mildly positive. It can come to an end at any time. The upside cmap for the 6 month cycle high dropped back to1405-1435, and we've seen those levels already. This will continue to change as the cycle begins to mature, but it raises the realistically possibility that the goose is already dead. Cmaps are
still pointing to a top around
1435. It may not make it. The downturn in the 4 week and 13 day cycle
indicators points to a low in the 1275 to 1300 range. The bounce to follow
will tell the tale as to whether the rally is over, or has a second wind.
Fiber Nacho Dump Levels- How low can you go? Nasdaq Cycle Conditions as of 8/27/02
PTT
- Periods Till Turn AM Edition Features (Previous) These features are in morning edition, published around 9 AM ET US, or the Saturday Weak End Edition, published, uh, let's see, Saturday! Golden Stool Cousin
HUI got a little bounce in his step yesterday. This picture isn't 100%
green however as a couple of shorter term indicators are signaling a
possible peak. If he breaks 125, he'll run back to 150. Otherwise he'll
pull back and consolidate more. Shorter cmaps here point to 127. Is this turn in bond yields for real? Has the bond bull market really ended. Was Doc's 10:17 AM call on August 14 the greatest in the history of stock proctology? Damned if I know! But it's
starting to look that way. Uncle Buck's Illness
Buck took ill yesterday. The intermediate cycle oscillator didn't confirm
the turn yet, but it looks like Buck will retest the July low in the weeks
ahead. Stocks will be right behind. Aerospace- This chart is
fascinating because it tells us something is about to happen. We just
don't know what yet. This could be the base for a major upmove, or it
could be just the opposite. Which means it will probably stay locked in a
tight range for months, frustrating everybody. Biodrech- Signs galore that
a big top is in, not the least of which is the possibility of the
completion of one of the most powerful of Dr. Stool's Rare Chart Patterns,
the Big Giant Whopsaw. Stoolies the world over watch for this rare signal
as a sign of great things to come. The Big Giant Whopsaw occurs when a
stock or index makes a clear technical breakout, consolidates, sucks in
everybody on The Street, and then suddenly and inexplicably fails, leaving
the entire world stranded at the top. This is one of the market maker's
favorite tools. The index must drop below 360 to complete the BGW
formation. It does look as though our cycle indicators have given us some
timely signals here, and it may be early in this drama. But we
should still be careful. Should the index fail to penetrate 360, this may
be the equally powerful, but opposite Return to the Scene of the Crime
pattern. Stay tuned! The Bonking suctor shows little change from yesterday. Drugs show signs of a
possible significant top. HMO's- Doc said months ago,
politics were going to be a problem for this group. Like the Druggies, if
your business is soaking, overcharging, and cheating the public,
eventually the flies are going to come home to roost politically. Senior
citizens vote in huge numbers, and that outweighs all the money, your
money, these characters spend on lobbying. OK, so Doc is reading more into
the charts, than is there. Write your Congressman and tell him or her you
want health care reform! Doc apologizes for editorializing. Consumer- tapped out, or
taking a breather? Retail is losing its wood
as well. Homebuilders- Trouble for
the bubble? Small craps- They got
thrown against the wall. Didn't stick. SOX- Here comes the
retest. Soft Where- Backing away
from top of channel. Nutworkers- Headed for
another breakdown. Telecoms- Top of channel. Internut- Good short
entry? Stoolwethers AMZN- Hunchback about to
give birth to bear cub? AhoL- Another Big Giant
Whopsaw in progress? CSCO- Rolling over at top
of channel. DELL- 10-13 week cycle top
looks in. GE- General Custer is
defending the top of the 6 month and 10-13 week cycle hill. IBM- verging on sell
signals. INTC- Breakdown imminent? Mr. Bill- Signs of 6 Month
Cycle top. Wally's- Watch out for the
bull fag. A hook for unsuspecting bears. See you in Intraday Stool. Dr. Stepan N. Stool Share your thoughts on the Stool Pigeons Wire.
Renewals Welcome, and thank you for subscribing to the Anals of Stock Proctology. Your trial subscription will run for 90 days. At the end of that period your subscription will renew automatically, unless you cancel. If you wish to cancel your subscription use the button below. If you want to renew your subscription do nothing. Your subscription will renew and your credit card or Paypal bank account will be charged. If you want to renew, be sure your credit card information in your Paypal account is current. Paypal will not renew your subscription if the card has expired! Again, thanks for subscribing!
Explanation of Intraday Commentary-Build charts at http://www.livecharts.com. For custom time bars insert a comma after symbol and number of minutes, e.g. compx,90. This will give you a bar chart of the Nas with 90 minutes per bar. The one day cycle is usually most clear with 8 minute bars and 26/18 stochastics. It varies from day to day. Sometimes 6 minutes works best. Experiment to find the best fit for your trading style, and the market's dominant frequency at the time. The goal here is primarily to monitor the condition of the 8 and 13 day cycles. I typically use 90 minute bars with 26/18 stochastics for the 13 day cycle proxy on the indices during regular trading hours. Other cycles use 26/18 stochastics with the following: 8 days- 60 minute bars On the 24 hour futures charts, use a time per bar approximately 3 to 4 times the above number of minutes, to represent the cycles listed above. ABBREVIATIONS: cma: centered moving average
|
||||||||||||||||||||||||||||||||||||||||||||||||||||||||||||||||||||||||||||||||||||||||||||||||||||||||||||||||||||||

![[Most Recent HUI from www.kitco.com]](http://www.weblinks247.com/indexes/idx24_hui_en_2.gif)
![[Most Recent XAU from www.kitco.com]](http://www.weblinks247.com/indexes/idx24_sp500_en_2.gif)
![[Most Recent Quotes from www.kitco.com]](http://kitconet.com/charts/metals/gold/t24_au_en_usoz_2.gif)