|
Archives 12/30/01, 1/1/02, 1/2/02, 1/3/02, 1/4/02, 1/7/02, 1/8/02, 1/09/02, 1/10/02, 1/11/02, 1/14/02, 1/15/02, 1/16/02, 1/17/02, 1/18/02, 1/22/02, 1/23/02, 1/24/02, 1/25/02, 1/28/02, 1/29/02, 1/30/02, 1/31/02, 2/1/02, 2/4/02, 2/5/02, 2/06/02, 2/7/02, 2/9/02, 2/11/02, 2/12/02, 2/13/02, 2/14/02, 2/16/02, 2/19/02, 2/20/02, 2/21/02, 2/23/02, 2/25/02, 2/26/02, 2/27/02, 2/28/02, 3/1/02, 3/04/02, 3/05/02, 3/06/02, 3/7/02, 3/10/02,3/11/02, 3/12/02, 3/13/02, 3/14/02, 3/15/02, 3/18/02, 3/19/02, 3/20/02, 3/21/02, 3/22/02, 3/25/02, 3/26/02, 3/28/02, 3/30/02 4/1/02, 4/2/02, 4/3/02, 4/4/02, 4/6/02, 4/8/02, 4/9/02, 4/10/02, 4/11/02, 4/13/02, 4/15/02, 4/16/02, 4/17/02, 4/18/02, 4/20/02, 4/22/02, 4/23/02,4/24/02,4/25/02, 4/26/02, 4/27/02, 4/29/02, 4/30/02 5/01/02, 5/2/02, 5/4/02, 5/6/02, 5/07/02, 5/8/02, 5/09/02, 5/10/02, 5/13/02, 5/14/02, 5/15/02, 5/16/02, 5/17/02, 5/20/02, 5/21/02, 5/22/02, 5/23/02, 5/24/02, 5/28/02, 5/29/02, 5/30/02 6/01/02, 6/3/02, 6/4/02, 6/5/02, 6/6/02, 6/7/02, 6/10/02, 6/11/02, 6/12/02, 6/13/02, 6/14/02, 6/17/02, 6/18/02, 6/19/02, 6/20/02, 6/22/02, 6/24/02, 6/25/02, 6/26/02, 6/27/02, 6/30/02 7/1/02, 7/4/02, 7/5/02, 7/11/02, 7/14/02, 7/15/02, 7/16/02, 7/17/02, 7/18/02, 7/19/02, 7/22/02, 7/23/02, 7/24/02, 7/25/02, 7/27/02, 7/29/02, 7/30/02 8/1/02, 8/3/02, 8/5/02, 8/6/02, 8/7/02, 8/8/02, 8/10/02, 8/12/02, 8/13/02, 8/14/02, 8/15/02, 8/16/02, 8/19/02, 8/20/02, 8/21/02, 8/22/02, 8/23/02, 8/26/02, 8/27/02
|
The Anals of Stock ProctologyPublished weeknights by
8:30PM Happy Acres, Florida Time The American Academy of Stock Proctology and Is your subscription up for renewal? If you want to renew, do nothing, unless your credit card has expired. Please be sure your credit card info is current. If your credit card has expired, you must enter the new expiration date in your Paypal account in order for your subscription to be processed. If you subscribed via Paypal, your subscription will be renewed for one year on the 90 day anniversary of your sign-up and your credit card will be charged. If you want to cancel, use the button at the bottom of the page. This applies only if you subscribed through Paypal. Mailed-in subscriptions are for 1 year. If you subscribed by prior contribution, I will send you a notice before your subscription expires. If you have any questions, see the subscription page and FAQ's. If you can't find the answer, email me. Update 8/29/02 1:15PM Terms and methodology They hit the cmaps on the open and reversed immediately as the Fed added a few bucks, and the sphincters did their usual month end painting of the tape. Up phases are now under way in the 1 day through 13 day cycles. The 1 day cycle should be topping out, but there are still some unmet upside cmaps. The 8 day cycle up phase should last 2-3 days. At this point the upside looks limited and the up phase should take the form of a trading range. Doc does not make trading recommendations. This update reports intraday time cycle estimates and centered moving average projections based on the Hurst cycle analysis method. Doc assumes no responsibility for the accuracy or inaccuracy of these estimates and projections. The market may or may not meet these projections. New stoolies should thoroughly familiarize themselves with the methodology before trading based on this method. There is no free lunch. Those who do not have the time or inclination to develop a trading strategy based on testing and research should not trade. Trade at your own risk.
Update 8/29/02 10:15AM - Revised 1 day cycle cmaps are as follows: Nas 1288, SPX 903, and NDX 925. All too close for comfort. Update 8/29/02 9:15AM Terms and methodology The engineers may be losing control of their little gambit, as the fucutures are getting creamed this morning. It now looks like that last minute rally yesterday was the 1 day cycle peak. Look for a 1 day cycle low around noon, with a possible 5 hour cycle low near or below that around 1-1:30. Be on the lookout for a big feed today as well, as Al responds to what looks like a meltdown in the making. The 8 day cycle low can come at any time between now and Tuesday. (Holiday Monday) Doc does not make trading recommendations. This update reports intraday time cycle estimates and centered moving average projections based on the Hurst cycle analysis method. Doc assumes no responsibility for the accuracy or inaccuracy of these estimates and projections. The market may or may not meet these projections. New stoolies should thoroughly familiarize themselves with the methodology before trading based on this method. There is no free lunch. Those who do not have the time or inclination to develop a trading strategy based on testing and research should not trade. Trade at your own risk.
Engineering the Perfect Bottom (8/28/02) The sphincters are out there cluck clucking, "Not to worry, just a normal pullback after the big move we had. Buy weakness." Then it dawned on Doc. They are deliberately trying to engineer a perfect bottom, with the selling in light volume to push the averages near test of the July low. Then they will redeploy the cash raised in this little gambit, buying stocks as the test is under way, in an attempt to officially kick off the bull season. Nice try guys, but we stoolies figured out your little game, and guess what? It ain't gonna work! You can't just engineer a perfect bottom to pre-ordained specifications. But this is a perfect setup for them. Everybody in the world now knows, thanks to crapvision, that to have a proper bottom, first you have a big selloff, then a big rally, then a light volume decline to "retest" the low of the first selloff. So they have a recipe, what do they do? Why cook the market of course. They can cook the books, can't they? Well why not "cook" the market. They can cook it for a little while, but eventually they run out of gas, and the market will go its merry way. Sure you'll get a little bounce, maybe even a pretty big bounce out of it if enough suckers are still out there to buy into this little subterfuge. But once that fails, as they say in the world of Stool Pigeons, look out below. There will be absolutely no buying power left. Instead of a bull stampede, they will have engineered yet another great collapse, potentially the biggest one yet. The little game will take at least a month to play out. Then we'll see who the real wise guys are.
Today there was another article in SeeBS.Markethype on why investors shouldn't sell, making the point that "Investors who withstand bear-market lows typically see 32.5 percent gain in first year of recovery." Which elicited the following email to the reporter from Doc:
There were a number of logical fallacies in the article. You may want to attack them on L.O.B. The Feed added $4 billion in overnight repos, as $2.25 billion was expiring for a net addition of $1.75 billion. The $4 billion will be the only rollover for Wednesday. Al continues to shinny along that 10% growth lower limit for the total Feed, and is
back in the middle of his go, no-go box. After Tuesday and Wednesday's abysmal market
performance, we still need to be vigilant for a really big one. Of
course, all Feeds have a flip side. That is, we know where they're
likely to stop and begin draining, and those peaks in Feed may be the best
overbought market indicators of all. Let's keep an eye on that too. The Feedometer
upticked slightly. The worse the market performs the greater the
likelihood of a Feeding
frenzy. But another way to look at this is that if all the excess Feed in
June and July could only result in a delayed 1/3 retracement of the
selloff, then Al and the Gang have lost their punch. Someone has to take
the handoff when they jam the market. That someone is the portfolio
sphincters and 27 year old hedge fund managers (thank you,k wndysrf). Joe
Public is not a factor, nor are the Japanese or Europeans, or Saudis.
Looking at the sphincters and hedgers, they are in no position to
take the handoff. So a big Feed can trigger a 4 hour jam, but that's about
it. And for every big Feed, there's a big drain to follow, the one the
market goes down in. As usual on Wednesday, we heard from the Mortgage Bonkers Ass., otherwise known as the Capone Gang. Surprise surprise, new mortgage apps downticked. In spite of near record low mortgage rates, demand is being rapidly exhausted. It's a simple fact. Demand cannot be sustained at this level without ever lower rates. Massive reliquefaction is still in the pipeline for the next 4-6 weeks, even if this is the applications peak. But just because there's a lot of liquidity flowing into one end of the system doesn't mean the system can't destroy it. There is still only one bottom line when it comes to stock prices. The market is the message. If everybody has quit on the market, no matter how much money is being pumped in other parts of the system, if the players don't want to play the stock market game, prices will fall, and destroy a lot of money in the process. Invariably we see a sharp slowing in the growth of the M's when stock prices drop sharply over a period of months. Why is that? The market is eating it, and flushing it when it comes out the other end. When you break out the purchase and refi applications separately on the chart, the picture is fascinating. On the purchase line (blue) there's a gorgeous hunchback top with weak right shoulder. If that hunchback should fall down, Doc will declare the end of the real estate bubble. The refi line (green) turned down at a double top. Demand has been stretched to the limit. The beginning of the deflation of the reflatulated bubble may be at hand. If so, all the markets and the entire economy will go down with it. This process will take months to play out, and we'll be watching with baited breath.
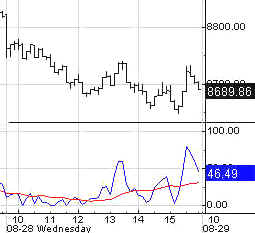
Portfolio Sphincters Index (SPX) and Sentiment
The selloff is starting to scare a few people. The VIX rose to 36.23. On the inverted scale chart it fell to the center of the Stool Band. Yesterday Doc mentioned that the final peak in this rally will probably not occur until the VIX and the upper blue band touch, and that it could happen retroactively as the channel changes direction. That is now a distinct possibility as the upper band gets dragged down. The other point that Doc makes repeatedly about sentiment indicators is that they follow price. Price indicators are the only ones you need. Doc inverted the scale on the VIX chart to show the correlation between price movements on the SPX and movements of the VIX. The VIX itself can be interpreted just like a price chart. First it break downs from massive top, then returns to the scene of the crime, then off in the direction of the original break. Price charts and sentiment charts are all reflections of the same thing, patterns of human behavior in markets. The
superimposed 6-7 week cycle (red line) oscillator fell again. The 10-13 week oscillator is
starting to roll over. The 17 day rate
of change, which is a proxy for the 6-7 week cycle, and the 29 day rate of change
(10-13 week cycle) are building top patterns. Until the 29 day ROC and the 10-13 week cycle oscillator
turn lower, it's likely there will be one more good pop to the upside
before the big down swing gets under way.. The 6 and 10-12 month oscillators are rising. That only tells us that these cycles are in an up phase. It does not tell us the strength of the phase, nor how long it will last. The stoolicator indicates an overbought uptrend. The short cycle oscillator is now coming down hard. In itself, that's not significant, other than to confirm that shorter cycles are headed down. This still must be considered a counter cyclical move relative to the 6 month cycle, although it may be the beginning of the 10-13 week cycle top. The 6-7 week and 4 week
cycles are in down phases.
The 8 and 13 day cycles were due for a low any day. 900 is now the cmap target for
the 13 day cycle and 860 on the 6-7 week cycle. Fiber Nacho Dump- INSTANT REPLAY of Tuesday's remarks - First stop 935, Naturally. What did you expect? There are scientific reasons for this. We just don't know what the hell they are. Wednesday or Thursday the decline will stop at 915, you just watch! This stuff drives Doc crazy because it's not part of cyclical analysis, and he has no idea why it works so often. Back to live action.
OK so they'll maybe hold here for a day, or they won't, because 900 is a
sure thing too. Right? The Cycle Conditions tables include cycle phase and a wild guess as to number of periods to the next turn, in days for the shortest cycles, weeks (W) or months (M) for the longer ones. This is a fluid exercise, in other words, the projections are likely to be wrong, but they force us to be vigilant for key turning points, and frequently work well enough to prevent costly misreadings. SPX Cycle Conditions as of 8/28/02
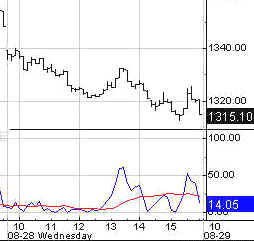
PTT - Periods Till Turn Nasgap Charts Rate of change indicators for both the 6-7 and 10-13 week cycles are getting closer to sell signals. . The stoolicator is also getting closer, but is still uptrending. Doc has the time inputs on the stoolicator set to avoid whipsaws, but it can be a little late at the top in a downtrend. And that's ok. The 6 month cycle oscillator looks like it's getting a bit of a flattop. If it rolls over here, that would be an enormously bearish signal. Let's try not to anticipate. Anticipating signals is almost always a beeeeg mistake. Once the lines cross on that oscillator, it will be time to short with reckless abandon. Cmaps
for the 10-13 week cycle dropped to 1420 and guess what? Been there done
that. We still need to see a confirming crossover on one of the
indicators, in particular the 10-13 week cycle ozzie. The downturn in the 4 week
cycle tentatively points to a low at 1220, while the 13 day cycle cmap is in the
1280 to 1300 range. The bounce to follow is the one devoutly to be wished
by bears patiently waiting for a good place to get short.
Fiber Nacho Dump Levels- How low can you go? Next stop 1290. Nasdaq Cycle Conditions as of 8/28/02
PTT
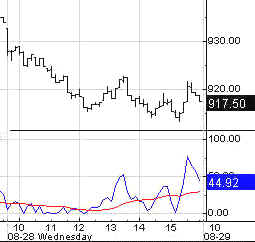
- Periods Till Turn AM Edition Features (Previous) These features are in morning edition, published around 9 AM ET US, or the Saturday Weak End Edition, published, uh, let's see, Saturday! Golden Stool HUI has a 13
day cycle cmap of 127. The oscillators are still mixed and it is unclear
whether the gold stocks can break out here or need to do more base
building. Doc still suspects the latter.
They're working to keep the lid on, but a breakout looks inevitable. Uncle Buck's Illness
Ole' Buck is over the hill, and he done ready to come on down. 106.50 this
morning. Suctor Watch -Stoolie richmtn suggested to Doc that the charts begin in October so that stoolies could compare the current period with the last analogous cycle period. Doc slaps his palm to his forehead and says, But, Of course! The charts are a little "scrunchy" but Doc will continue to show a full year at least. Many Tanks and dungs a lot to rich for the suggestion. Biodrech- The Big Giant
Whopsaw is complete. Let the games begin. Bonkers- Another top in the
making. Consumer- Also top building,
but short cycle is getting near a trampoline bounce. Retail- Here's another one. Drugs have the same basic
config as Bonks and Consumer. HMO's- Doc is biased. Can't
give honest opinion about a group he can't stand. I mean, who hasn't been
at least annoyed, not to mention those who have been screwed by their HMO?
But this is a perfect example of how Wall Street doesn't get it and
doesn't give a crap. They will tout literally anything, if there are
banking fees to be had. Bubble- There are a couple
of ways this could play out. A failure of the up phase at this level would
suggest that a huge top is forming. Small Crap- Gonna get
flushed. Energy- Pause, or out of
gas? Trannies look ooogly. SOX- Next stop 250. Soft Where- Getting back in
the channel again. Nutworkers- Bottom
dropping. Telecoms- Perfect short
setup? Yikes- Yikes. Stoolwethers AhOL- Back to single
digits...for good. AMZN- Giant hunchback. Citicorpse- 10-13 topping.
What shape the down phase? CSCO- Another 10-13 week
top. DELL- And another. General Custer- Big Giant
Whopsaw in progress? IBM- Another Big Giant
Whopsaw. INTC- Bottom dropping in
the making. JPM- Nice looking potential
short setup. MMM- Market Maker
Management building a 10-13 week cycle top.
See you in Intraday Stool. Dr. Stepan N. Stool Share your thoughts on the Stool Pigeons Wire.
Renewals Welcome, and thank you for subscribing to the Anals of Stock Proctology. Your trial subscription will run for 90 days. At the end of that period your subscription will renew automatically, unless you cancel. If you wish to cancel your subscription use the button below. If you want to renew your subscription do nothing. Your subscription will renew and your credit card or Paypal bank account will be charged. If you want to renew, be sure your credit card information in your Paypal account is current. Paypal will not renew your subscription if the card has expired! Again, thanks for subscribing!
Explanation of Intraday Commentary-Build charts at http://www.livecharts.com. For custom time bars insert a comma after symbol and number of minutes, e.g. compx,90. This will give you a bar chart of the Nas with 90 minutes per bar. The one day cycle is usually most clear with 8 minute bars and 26/18 stochastics. It varies from day to day. Sometimes 6 minutes works best. Experiment to find the best fit for your trading style, and the market's dominant frequency at the time. The goal here is primarily to monitor the condition of the 8 and 13 day cycles. I typically use 90 minute bars with 26/18 stochastics for the 13 day cycle proxy on the indices during regular trading hours. Other cycles use 26/18 stochastics with the following: 8 days- 60 minute bars On the 24 hour futures charts, use a time per bar approximately 3 to 4 times the above number of minutes, to represent the cycles listed above. ABBREVIATIONS: cma: centered moving average
|
||||||||||||||||||||||||||||||||||||||||||||||||||||||||||||||||||||||||||||||||||||||||||||||||||||||||||||||||||||||

![[Most Recent HUI from www.kitco.com]](http://www.weblinks247.com/indexes/idx24_hui_en_2.gif)
![[Most Recent XAU from www.kitco.com]](http://www.weblinks247.com/indexes/idx24_sp500_en_2.gif)
![[Most Recent Quotes from www.kitco.com]](http://kitconet.com/charts/metals/gold/t24_au_en_usoz_2.gif)