|
Archives 12/30/01, 1/1/02, 1/2/02, 1/3/02, 1/4/02, 1/7/02, 1/8/02, 1/09/02, 1/10/02, 1/11/02, 1/14/02, 1/15/02, 1/16/02, 1/17/02, 1/18/02, 1/22/02, 1/23/02, 1/24/02, 1/25/02, 1/28/02, 1/29/02, 1/30/02, 1/31/02, 2/1/02, 2/4/02, 2/5/02, 2/06/02, 2/7/02, 2/9/02, 2/11/02, 2/12/02, 2/13/02, 2/14/02, 2/16/02, 2/19/02, 2/20/02, 2/21/02, 2/23/02, 2/25/02, 2/26/02, 2/27/02, 2/28/02, 3/1/02, 3/04/02, 3/05/02, 3/06/02, 3/7/02, 3/10/02,3/11/02, 3/12/02, 3/13/02, 3/14/02, 3/15/02, 3/18/02, 3/19/02, 3/20/02, 3/21/02, 3/22/02, 3/25/02, 3/26/02, 3/28/02, 3/30/02 4/1/02, 4/2/02, 4/3/02, 4/4/02, 4/6/02, 4/8/02, 4/9/02, 4/10/02, 4/11/02, 4/13/02, 4/15/02, 4/16/02, 4/17/02, 4/18/02, 4/20/02, 4/22/02, 4/23/02,4/24/02,4/25/02, 4/26/02, 4/27/02, 4/29/02, 4/30/02 5/01/02, 5/2/02, 5/4/02, 5/6/02, 5/07/02, 5/8/02, 5/09/02, 5/10/02, 5/13/02, 5/14/02, 5/15/02, 5/16/02, 5/17/02, 5/20/02, 5/21/02, 5/22/02, 5/23/02, 5/24/02, 5/28/02, 5/29/02, 5/30/02 6/01/02, 6/3/02, 6/4/02, 6/5/02, 6/6/02, 6/7/02, 6/10/02, 6/11/02, 6/12/02, 6/13/02, 6/14/02, 6/17/02, 6/18/02, 6/19/02, 6/20/02, 6/22/02, 6/24/02, 6/25/02, 6/26/02, 6/27/02, 6/30/02 7/1/02, 7/4/02, 7/5/02, 7/11/02, 7/14/02, 7/15/02, 7/16/02, 7/17/02, 7/18/02, 7/19/02, 7/22/02, 7/23/02, 7/24/02, 7/25/02, 7/27/02, 7/29/02, 7/30/02 8/1/02, 8/3/02, 8/5/02, 8/6/02, 8/7/02, 8/8/02, 8/10/02, 8/12/02, 8/13/02, 8/14/02, 8/15/02, 8/16/02, 8/19/02, 8/20/02, 8/21/02, 8/22/02, 8/23/02, 8/26/02, 8/27/02, 8/28/02, 8/29/02, 8/30/02 9/3/02, 9/4/02, 9/5/02. 9/6/02, 9/9/02, 9/10/02, 9/11/02, 9/12/02, 9/13/02, 9/16/02, 9/17/02, 9/18/02, 9/19/02, 9/20/02, 9/23/02, 9/24/02, 9/25/02, 9/26/02, 9/27/02, 9/30/02 10/1/02, 10/2/02, 10/3/02, 10/4/02, 10/7/02, 10/8/02, 10/9/02, 10/10/02, 10/11/02, 10/14/02, 10/15/02, 10/16/02, 10/17/02, 10/18/02, 10/21/02, 10/22/02, 10/23/02, 10/24/02, 10/25/02, 10/28/02, 10/29/02, 10/30/02, 10/31/02 11/1/02, 11/4/02, 11/5/02, 11/6/02, 11/7/02, 11/8/02, 11/11/02, 11/12/02, 11/13/02, 11/14/02, 11/15/02, 11/18/02, 11/19/02, 11/20/02
|
The Anals of Stock ProctologyPublished weeknights by
8:30PM Happy Acres, Florida Time The American
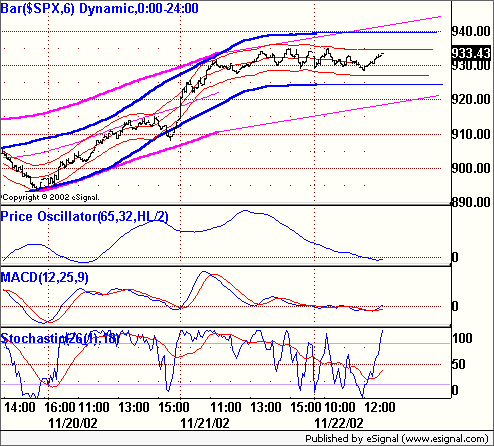
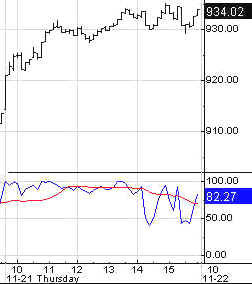
Academy of Stock Proctology and Is your subscription up for renewal? If you want to renew, do nothing, unless your credit card has expired. Please be sure your credit card info is current. If your credit card has expired, you must enter the new expiration date in your Paypal account in order for your subscription to be processed. If you subscribed via Paypal, your subscription will be renewed for one year on the 90 day anniversary of your sign-up and your credit card will be charged. If you want to cancel, use the button at the bottom of the page. This applies only if you subscribed through Paypal. Mailed-in subscriptions are for 1 year. If you subscribed by prior contribution, I will send you a notice before your subscription expires. If you have any questions, see the subscription page and FAQ's. If you can't find the answer, email me. Doc does not make trading recommendations. This update reports time cycle estimates and centered moving average projections based on the Hurst cycle analysis method. This publication is for entertainment and educational purposes only. Doc assumes no responsibility for the accuracy or inaccuracy of the estimates and projections presented. The market may or may not meet the projections. Stoolies should thoroughly familiarize themselves with the methodology before trading based on this method. Those who do not have the time or inclination to develop a trading strategy based on testing and research should not trade. Trade at your own risk. Yadda yadda. How's your motha? Be a Johnny Applestool! Help spread the Stool! Feel free to repost snippets from the Anals on message boards around the web. Just give a link back! Many tanks - Doc Mid Day Update 1 PM Both the 5 and 8 day cycle cmaps now look like 935 on the hourly charts as a result of the stall. Other than that the range is too narrow to make a cmap forecast on the shorter waves. The 1 day cycle is in a weak up phase. It should end by 2 PM. After that hopefully we'll get a downdraft into the close. But for now, flat's the word. 5-8 Day Cycle______ 2-3 Day Cycle_______ 5 Hr-1 Day Cycle
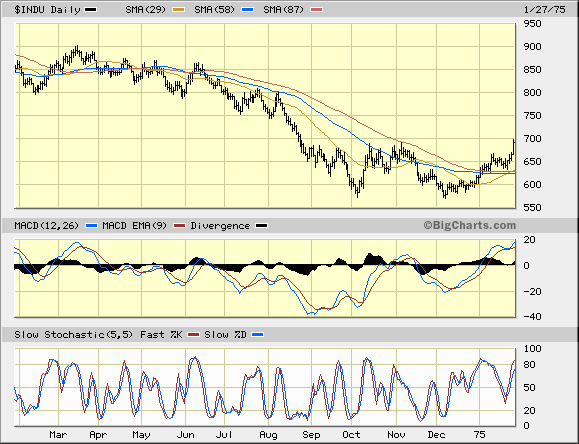
Update 10:40 AM The early failure of the 1 day cycle up phase is a good sign but until the SPX drops below 929, it's too early to draw any conclusions or make price projections. Will update at the usual time 12:30 - 1PM. Pre Market Update 11/22/02 9:15 AM Minor weakness in the fucutures this morning as they're heading into their 1 day cycle low. Now trading around 930.20. We should still have an up phase coming in the morning after a slightly soft open, but it may not be the blowoff I had guessed last night in the Intraday Outlook. I won't change the pre market cycle map just yet, but if anything significant happens in the first half hour or so, will post update here. Doc's Nightmare (11/21/02) Where have I seen this before,
thought Doc? And then it dawned on him. Here's what it did in the year
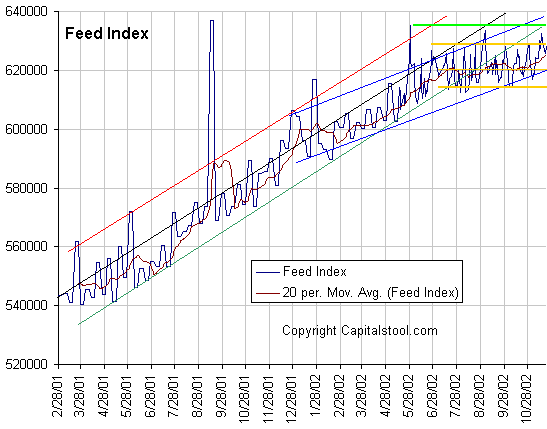
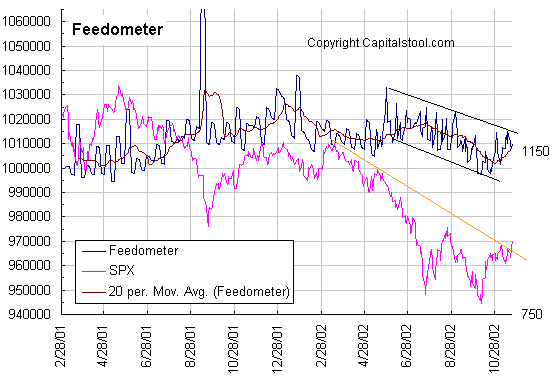
following. Admittedly, this is an ugly and frightening comparison for Doc and our merry band of stoolies. BUT, we still have a leg to stand on. Where we are now is akin to the day BEFORE the breakout day in 1975. On January 27, 1975, the Dow broke out above the highs it had set on the previous intermediate wave. In the current scene, the Dow is still about 2% below the August high. Doc's bet is that this market will run out of gas and not close above the August high. A lot can happen in a day, and Friday is the day. The Feed did a bit of addition, adding a net of $2.5 billion. They rolled an expiring $2 billion in 28 day repos into a new set of $3 billion. A $2.5 billion matched sale-purchase expired, offset by the expiration of $7.25 billion in 3 day repos. They also added $6.25 billion in overnight repos. The $6.25 billion is the only expiration on Friday. Al seems to be sticking around the center of the 8% growth channel that they have been in for almost a year. Growth is still zero over the last six months. The next week should tell the tale one way or the other how serious they are about reflatulating the bubble. Three
trends are evident on the Feed Index, which is the total Fed holdings of
loans and securities. One is the 10% growth trend beginning in May of
2001. Feed growth has recently been at or below the lower boundary of that
trend. The blue channel going back to last December suggests that Al may
now be targeting an 8% growth rate. Then there's the golden box which says
he's stopped growing Feed altogether over the last five months. The Feedometer is in a short term uptrend, but intermediate downtrend. There's nothing excessive in terms of jamming, although one would have to be insane not to think 8% growth is not inflationary when the economy is growing at 2.5%. Of course, what the Feed creates, the markets and debt bubble economy can destroy. One force is inflationary, the other deflationary. The
Feedometer theoretically
measures excess Feed available for bond or stock market jamming. Bond yields
rose again, as bonds were sold, and stocks bought. The 6 and 10-12 month
cycles continue rising. The 10-13 week cycle is in a sideways down phase
and the short cycles are heading up. With mixed cycles a breakout does not
appear imminent, but push comes to shove at 4.25. If it gets
through, the next stop is 4.70, and confirmation of a major uptrend. Game,
set, and match for the credit bubble. It can only survive as long as
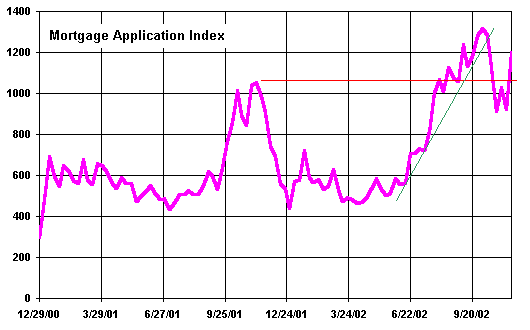
interest rates fall. Weekly Money Review The Mortgage Bonkers Ass. weekly
application index, better known to Stoolies as the Mo Gauge, rose last
week in response to Al ripping off the big one, the 1/2% cut. Mortgage
creation follows the application, and when the GSE's hold them in their
own portfolios, it's just as good as Feed in pumping gas into the bubble.
But with the behavior of the bond market the last few days, the refi
madness game is over. Once the residual mortgage creation is finished, the
squeeze will be on. Goodbye! We've been expecting to see a
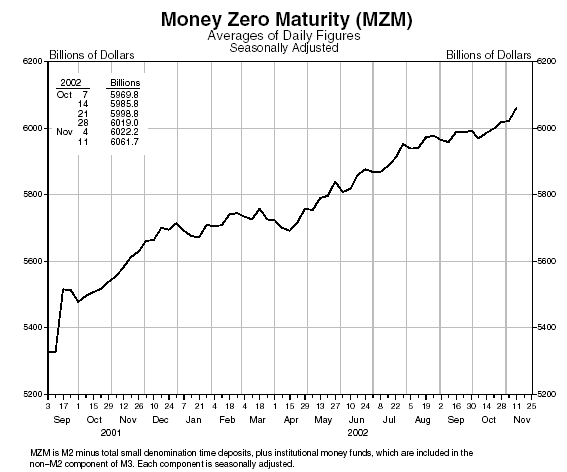
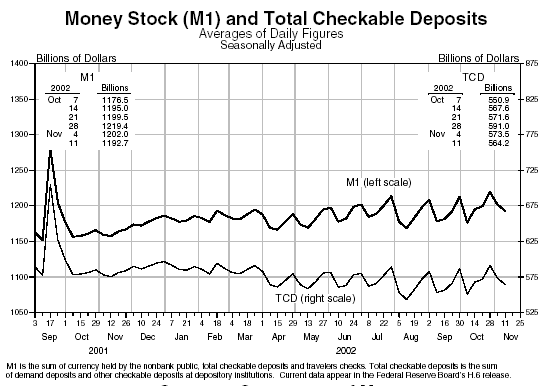
surge in broad money on the heels of the mortgage application boom. Here
it is. Al had been tapping the Feed brakes through September, but once he
took his foot of the brake and started giving it a little gas back in
early October, it was off to the races. Guess what went with it?
Just enough of that refi money found its way into the stock market to give
us the current state of froth in the stock market. MZM and M3 should
continue to rise as mortgages already in the pipeline are funded, and that
will probably keep a bid under the market until roughly 6 weeks after the
peak in mortgage applications. That means probably some time in
December. There hasn't been much of a trickle
down into checking accounts, indicating weak activity outside the
financial sector. It's one reason they are so desperate to keep the bubble
inflated. The opposite of inflation is, in this case, implosion. What they
appear to be shooting for is a "controlled bubble." It's a
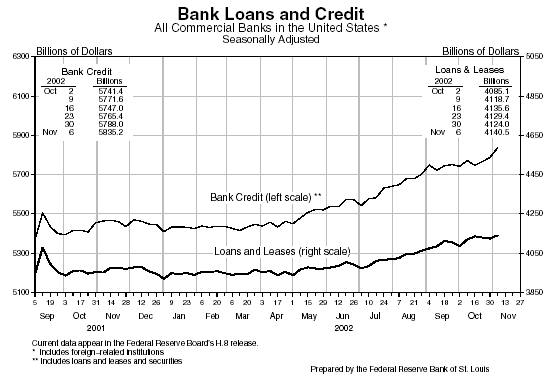
confidence game and shell game that will break down in the end. Bank credit began expanding rapidly
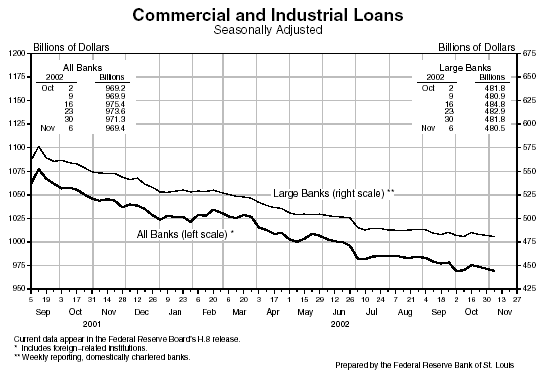
again in late October. Not loans and leases, as you can see. Most likely
all manner of derivatives. Commercial lending remains in a
death spiral. There's apparently enough liquidity in the pipeline to keep the bubble infarted for perhaps another month. After that, it will take a miracle to keep bond yields dropping enough to keep the game going. The chart says it's not in the cards, but the crisis point, when rates begin to accelerate upwards is probably not here yet..
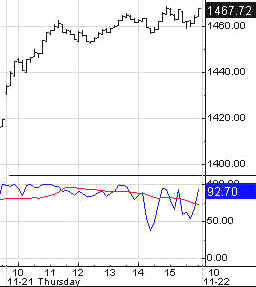
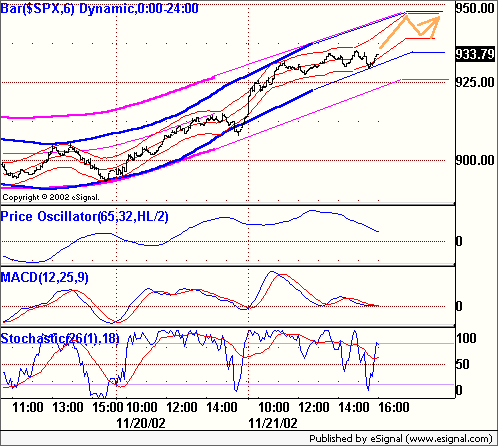
Intraday Outlook - The 1 day cycle turned up late after what looked like a sideways down phase. The 5 through 13 day cmaps moved up to 940-45 on the hourly charts. That's higher than on the daily charts. 5 hour and 1 day highs are due again at 11 AM and 1 PM +/-. It's too early for cmaps on those cycles. But they could reach the cmaps for the 5- 13 day waves. An alternative projection has the waves rolling over from the current level. The worst case is posted below. The AM update based on the futures will be posted at 9:15 NY time. 5-8 Day Cycle______ 2-3 Day Cycle_______ 5 Hr-1 Day Cycle
All of Doc's
daily cycle charts are powered by METASTOCK Portfolio Sphincters Index (SPX) and Sentiment Sentiment and Momentum Indicators
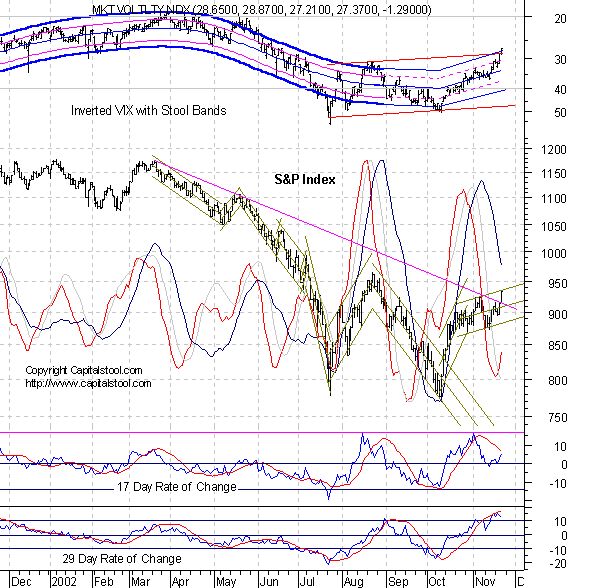
The 17 day rate of change is a proxy for the
6-7 week cycle. the 29 day rate of change is a proxy for the 10-13 week
cycle. The dark blue overlaid line is the 10-13 week cycle
oscillator, while the red line is the 6-7 week cycle oscillator. The VIX
is a measure of implied options volatility reflecting relative fear or
complacency. It is plotted below on an inverse scale to better show the
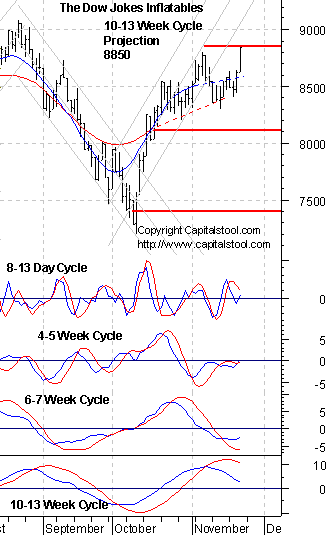
relationship to the price chart. The "Stool Bands may reflect either
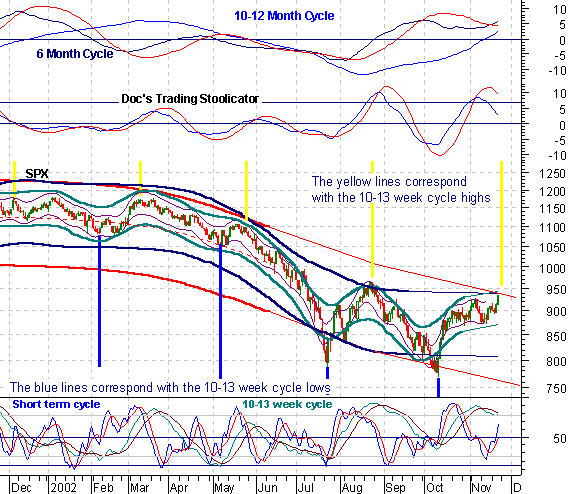
6 month or 10-12 month cycles. Short Term Cycles The 13 day cycle top is due now. The cmap is 935 or 945, depending on whether looking at end of day or hourly data. The 6-7 week cycle has apparently merged with the 4 week cycle and is heading up, but it is also due to top out any time over the next two weeks. Friday-Monday would not be inconsistent with that. Doc said yesterday that," The cycle high is due at the same time that the index will likely blow through the downtrend line from the March high. That's a classic set-up for a Whopsaw and major reversal." That's what happened Thursday. Now we find out if it's right. 10-13 Week Cycle The 10-13 week cycle cmap upticked to 940. The cycle indicators are still heading down, and the 29 day rate of change is starting to roll over. It's put up or shut up time. If this is a blowoff, i needs to reverse with little additional upside. Otherwise we are looking at a trending market similar to January 1975. The cycle low is due in late December through mid January. The probability of breaking the lows on this cycle is growing increasingly remote. VIX The VIX in an endgame kind of move, as a full scale buying panic rages. We have gone from complacency to ebullience to hysteria. The last time the VIX had blown this far through rising stool cycle bands on the inverted scale chart was June 5 2001. It was a secondary blowoff top preceding a 300 point decline in 3 months. But at this point, perhaps there's no reason VIX wont' get back to 20. Cycle Chart The Cycle Conditions tables include cycle phase and a wild guess as to number of periods to the next turn, in days for the shortest cycles, weeks (W) or months (M) for the longer ones. This is a fluid exercise, in other words, the projections are likely to be wrong, but they force us to be vigilant for key turning points, and frequently work well enough to prevent costly misreadings. SPX Cycle Conditions as of 11/21/02
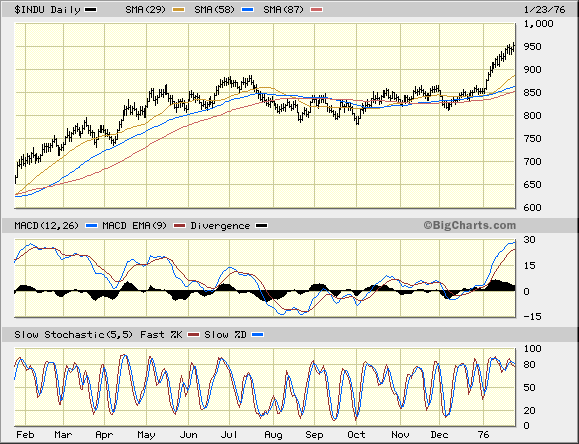
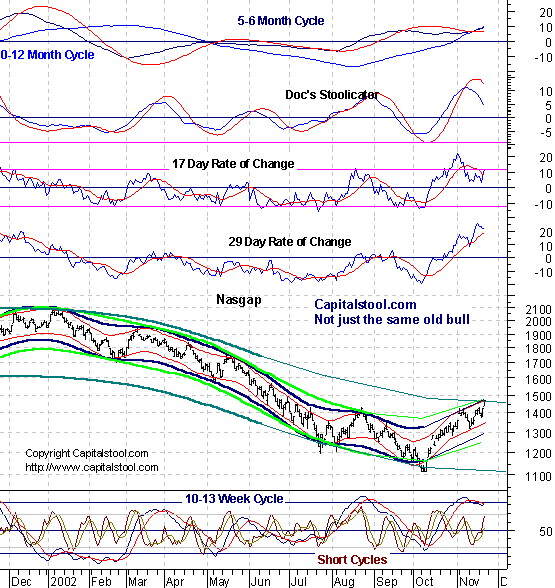
PTT - Periods Till Turn Nasgap Charts Cycle Chart Short Term Cycles The 13 day cycle is due to top out, with a cmap now at 1475, after the damn thing went vertical yesterday. Another upward revision at this point is unlikely. The actual lagging moving averages will cross on Friday. If they continue higher from here, the only possible conclusion is that the market is trending up under the influence of larger cycles. The 6-7 week cycle apparently merged with the 4 week cycle and bottomed last week. This cycle could top out at any time, but there's nor projection because the underlying moving averages are still parallel. 10-13 Week Cycle The 10-13 week cycle indicator upticked but not enough to for a whipsaw across the smoother which is still declining. So it still looks like a top phase, rather than a trending market. Exactly where the upper long term channel line is we won't know until after the fact, but it's somewhere around these levels. There's no evidence yet that the long term trend is broken but if they manage to push higher from here, that will need to be rethunk. Nasdaq Cycle Conditions as of 11/21/02
PTT
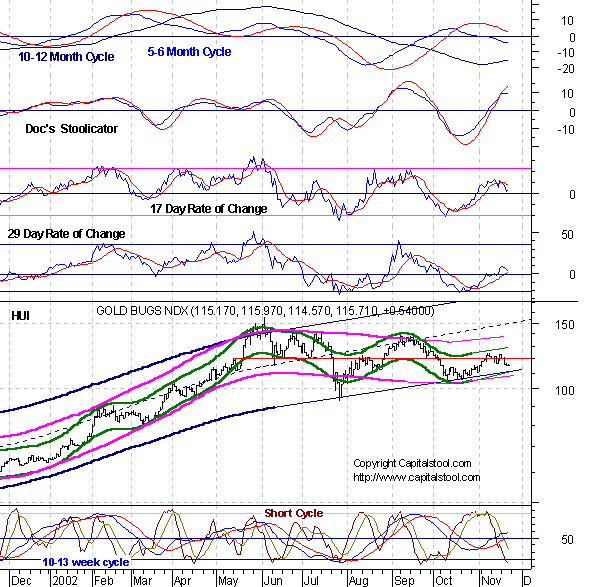
- Periods Till Turn Long Bong Hit - See top of page. AM Edition Features (Previous) These features are in morning edition, published between 7:30-8 AM ET US, or the Saturday Weak End Edition, published, uh, let's see, Saturday! Golden Stool The short cycle
ozzie is in the bottom zone and the short term downside cmaps of 114-115
have been hit. HUI should stabilize, and then make another run at 125. The
10-13 week cycle up phase may be running out of time, and after this rally
attempt the gold stocks should pull back again. The size of this coming
loop will tell us whether the longer term cycle is still tilted up,
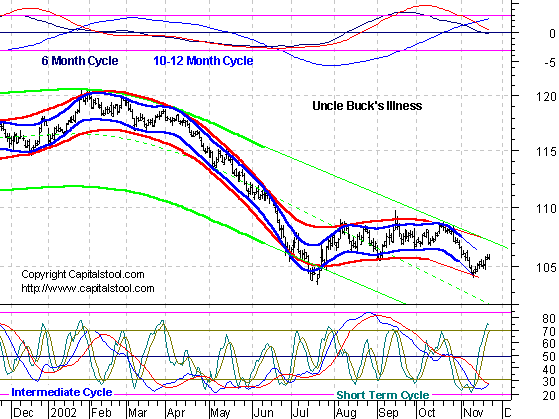
or has gone flat. Uncle Buck's Illness
Uncle Buck is trading around 105.70 in early morning trading, near where
it closed. Nothing dramatic happened overnight. The short cycle up phase
is probably out of gas, but the intermediate cycle looks like it wants to bottom.
Looks like old Buck will be stuck. Support is strong at 104, and sellers
come out in the 106-107 area. Trends in the Uncle Buck are well correlated
with the stock market, often with a lead of a few weeks or months. Suctor Watch and Stoolwethers- Now posted on separate page. Updated each morning between 8 AM and 9:30 AM NY time. See you in Intraday Stool. Dr. Stepan N. Stool Share your thoughts on the Stool Pigeons Wire.
Renewals Welcome, and thank you for subscribing to the Anals of Stock Proctology. Your trial subscription will run for 90 days. At the end of that period your subscription will renew automatically, unless you cancel. If you wish to cancel your subscription use the button below. If you want to renew your subscription do nothing. Your subscription will renew and your credit card or Paypal bank account will be charged. If you want to renew, be sure your credit card information in your Paypal account is current. Paypal will not renew your subscription if the card has expired! Again, thanks for subscribing!
Explanation of Intraday Commentary-Build charts at http://www.livecharts.com. For custom time bars insert a comma after symbol and number of minutes, e.g. compx,90. This will give you a bar chart of the Nas with 90 minutes per bar. The one day cycle is usually most clear with 8 minute bars and 26/18 stochastics. It varies from day to day. Sometimes 6 minutes works best. Experiment to find the best fit for your trading style, and the market's dominant frequency at the time. The goal here is primarily to monitor the condition of the 8 and 13 day cycles. I typically use 90 minute bars with 26/18 stochastics for the 13 day cycle proxy on the indices during regular trading hours. Other cycles use 26/18 stochastics with the following: 8 days- 60 minute bars On the 24 hour futures charts, use a time per bar approximately 3 to 4 times the above number of minutes, to represent the cycles listed above. ABBREVIATIONS: cma: centered moving average
|


![[Most Recent HUI from www.kitco.com]](http://www.weblinks247.com/indexes/idx24_hui_en_2.gif)
![[Most Recent XAU from www.kitco.com]](http://www.weblinks247.com/indexes/idx24_sp500_en_2.gif)
![[Most Recent Quotes from www.kitco.com]](http://kitconet.com/charts/metals/gold/t24_au_en_usoz_2.gif)