|
10 Minute Bar Charts 6/19/02 Dow Jokes Inflatables
Archives 12/30/01, 1/1/02, 1/2/02, 1/3/02, 1/4/02, 1/7/02, 1/8/02, 1/09/02, 1/10/02, 1/11/02, 1/14/02, 1/15/02, 1/16/02, 1/17/02, 1/18/02, 1/22/02, 1/23/02, 1/24/02, 1/25/02, 1/28/02, 1/29/02, 1/30/02, 1/31/02, 2/1/02, 2/4/02, 2/5/02, 2/06/02, 2/7/02, 2/9/02, 2/11/02, 2/12/02, 2/13/02, 2/14/02, 2/16/02, 2/19/02, 2/20/02, 2/21/02, 2/23/02, 2/25/02, 2/26/02, 2/27/02, 2/28/02, 3/1/02, 3/04/02, 3/05/02, 3/06/02, 3/7/02, 3/10/02,3/11/02, 3/12/02, 3/13/02, 3/14/02, 3/15/02, 3/18/02, 3/19/02, 3/20/02, 3/21/02, 3/22/02, 3/25/02, 3/26/02, 3/28/02, 3/30/02 4/1/02, 4/2/02, 4/3/02, 4/4/02, 4/6/02, 4/8/02, 4/9/02, 4/10/02, 4/11/02, 4/13/02, 4/15/02, 4/16/02, 4/17/02, 4/18/02, 4/20/02, 4/22/02, 4/23/02,4/24/02,4/25/02, 4/26/02, 4/27/02, 4/29/02, 4/30/02 5/01/02, 5/2/02, 5/4/02, 5/6/02, 5/07/02, 5/8/02, 5/09/02, 5/10/02, 5/13/02, 5/14/02, 5/15/02, 5/16/02, 5/17/02, 5/20/02, 5/21/02, 5/22/02, 5/23/02, 5/24/02, 5/28/02, 5/29/02, 5/30/02 6/01/02, 6/3/02, 6/4/02, 6/5/02, 6/6/02, 6/7/02, 6/10/02, 6/11/02, 6/12/02, 6/13/02, 6/14/02, 6/17/02, 6/18/02
|
The Anals of Stock ProctologyPublished weeknights by
8:30PM Happy Acres, Florida Time The American Academy of Stock Proctology and PM Update 6/20/02 1 PM Terms and methodology Approaching 1 PM the 5 hour and 1 day cycles should be peaking. The down phase should carry into the close. The 5 day cycle lows are due today or tomorrow. The cmaps have moved lower since this morning. All of which suggests that the market could have a pretty good sized break this afternoon. As always, these are guidelines. You should watch the appropriate stochastics or similar indicators for your trading signals. See Terms and methodology. Doc does not make trading recommendations. This update reports intraday time cycle estimates and centered moving average projections based on the Hurst cycle analysis method. Doc assumes no responsibility for the accuracy or inaccuracy of these estimates and projections. The market may or may not meet these projections. New stoolies should thoroughly familiarize themselves with the methodology before trading based on this method. There is no free lunch. Those who do not have the time or inclination to develop a trading strategy based on testing and research should not trade. Trade at your own risk. On the other hand, if you made any extra this week on account of The Stool, send it in!
AM Update 6/20/02 9 AM Terms and methodology Doc's "remote viewer" is wildly bearish, but he'll do his best to give you his usual "unbiased" analysis. The 5 hour and 1 day cycle lows are due on the open through 10:45 AM. The centered moving average projections are based on yesterday's action in the indexes. Nas 100 futures this morning suggest the AM lows may not be as low as the index projections. Both targets are reported below. The 5 day cycle low is due today or tomorrow. The cmaps are iffy for this cycle. A couple more data points are needed. I'll post any significant change if necessary.
How Do They Know? (6/19/02) Does it strike you as funny that, every night immediately after the bell, the poodits are able to tell us exactly why the market moved. Today's excuse was yet another horrifying terrorist bombing in Israel. They must take a poll of a statistically significant sample of those who actually traded during the day, asking them, what did you buy or sell today, and why? Obviously, the survey respondents told them, "We sold more stock than we bought today because of the terrorist bombing in Israel." Well? That's what they're reporting, so they must have taken a survey to find out right? Gyad. What a load of crap. How come nobody says, "Stocks fell today because there were more buyers than sellers, and the Feed did not supply enough reserves to market making firms to support the market in the absence of foreign and domestic demand. Specialists and market making firms were consequently unwilling to step in and buy. Since they are heavily short, and believe the market will fall farther in the coming weeks, they stepped aside and let nature take its course." Never happen. The Feed was neutral, adding $2.75 billion in repos, but retiring $3 billion from Tuesday. Al was in position to jam, but in spite of bad news from several tech corpses, and horrendous futures action, he gave the market the back of his hand. Doc isn't here to speculate on the whys and the wherefores, just report the whats, but, admittedly this wass surprising. The total Feed is back at the trend
level from which they've always pumped hard in the last 15 months. With
the market again on the verge of a meltdown, will they pump again? The Fed
must be well aware that each succeeding jam has had less and less effect
on the stock market, and something to do with the weakness in the dollar.
So we also need to be alert for a change of Fed tactics. Is it possible
that at some point they will finally decide to stop force feeding the
bubble? Keep your eye on the green trendline for signs of continuation,
or change. The Fast Feedometer, which
attempts to measure the amount of excess Feed available for jamming the
stock market, remains neutral. No gruel for the poor market. The Slow Feedometer continues to
trend
up, but another drain will begin to turn it lower. Stocks will turn down
sharply if that happens. If the Feed is anything less than aggressive
stocks will be liquidated. Meanwhile in the M3 end of the champagne music machine, the credit bubble limps along. In spite of near record low interest rates, the new mortgage originations which feed into the broad money supply a few weeks down the road are only flat. Declining interest rates no longer stimulate credit demand, a sign that the deflation of the bubble has begun. The Mortgage Bonkers Ass. reported:
Mortgage apps remain in a flat
trend, following the 4th quarter bulge that triggered the big bump in the
bubble economy.
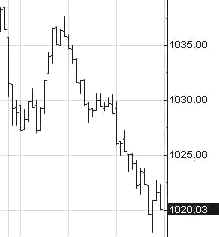
Portfolio Sphincters Index (SPX) and Sentiment The Sphincters Index lost 17 to 1020. The 17 day rate of change, which represents the 6-7 week cycle, fell before triggering a buy signal. The 6-7 week oscillator superimposed on the price chart, rose and flashed a buy signal indicating an up phase is underway in that cycle. Keep in mind that this only means "up" relative to the next larger cycle. If the larger cycles are falling hard, the up phase in the 6-7 week cycle will be crushed. The 10-13 week cycle oscillator (navy) flattened. The timing isn't right for a bottom in that cycle and the brief pause looks like just a way station in the decline. The 29 day rate of change whipsawed back down from the previous days upturn and is still in a flat pattern. A flat pattern in negative territory indicates a stable downtrend. A breakout from the range, in either direction would be a powerful signal. It will be down, of course. The VIX rose to 29.71. On the inverted scale chart, VIX is sliding on a track just inside the lower band. The lower band penetration appears to coincide with a 6-7 week cycle low, but it doesn't look like the extreme fear that tends to persist for several days at a 10-12 month cycle low. The current position is neutral. With the trend channel possibly heading lower for weeks, the final extremes at the bottom could be as low, or lower, than the levels reached in September. The blue channel lines are the extension of a linear
regression channel from the February and May 2001 highs. The 6 month cycle
oscillator is close to a signal but close doesn't count. It must be a
definitive crossover. Anything less is just a tease. If the indicator turns, it has to be
respected and if it turns down again that too must be respected. But that also applies if it remains
in a flat trend at this level. That would indicate trending. The trading
stoolicator still supports the assumption that the key trading cycles have
not turned. They remain down. The short cycle oscillator is approaching
top territory. The 10-13 week cycle oscillator upticked, but
the trend is still down. The price action staged a classic return to the
scene of the crime (reaction rally to the point of breakdown), was
captured again, and is now headed back to Sing Sing. The drop on Wednesday was a fiber nacho 38.2%
from Tuesday's high. Next is 1011 and 1006, and if not there, then a full
retest of Friday's low. The Cycle Conditions tables include cycle phase and a wild guess as to number of periods to the next turn, in days for the shortest cycles, weeks (W) or months (M) for the longer ones. This is a fluid exercise, in other words, the projections are likely to be wrong, but they force us to be vigilant for key turning points, and frequently work well enough to prevent costly misreadings. SPX Cycle Conditions as of 6/19/02
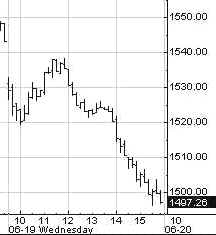
PTT - Periods Till Turn Nasgap Charts The Nasgap
lived up to its name on the open, and blew out 46 chunks the rest of the
day, to one four niner sixer. That's right folks. They broke the juicy
round number at the close.That's gonna make a few of those September
bottom genius buyers think twice. The 6 month
cycle time series is still drifting down. The 10-13 week cycle
oscillator and the trading stoolicator also turned back down. The
Nascrap 100 has already broken down. This index is the institutional
portfolio sphincter destroyer. It's not
shown on the chart, but Wednesday's drop was an exact 61.8% retracement of
the two day rally. The next sop is 1450, then 1400. Nasdaq Cycle Conditions as of 6/19/02
PTT
- Periods Till Turn AM Edition Features (Previous) Bond yields are in a
meltdown, as investors flee stocks and US investors move to bonds. A major
resistance level has broken. The implication is that the October low could
be tested. Since the entire investing world was betting a month ago that
bond yields would rise, this has to be a nightmare for some derivatives
players. It also means that stock prices will fall twice as hard. There is
one caveat. The cycle oscillators are at bottoming levels. When they turn
up, the move will be over. But that appears to be at least several days to
several weeks away. The dirty
SOX got bombed yesterday. The short cycle ozzie reversed, suggesting a
week or two of downside. All other indicators are pointing down. Look for
a near term move to 350. The Rusty
2000 small craps is Wall Street's stealth bull market chart. Gotta look
really hard to find it. 450 is critical support. It's going to break, and
when that happens the stealth bull market thesis will be blown to bits. Retail is
another stealth bull market group. Short cycle sell signal yesterday means
look for a move to 315 on this chart. Internet
stocks, remember them? the bottom's gonna drop out again. Intel is
poised to take out the September lows on its way to $5. IBM is also
poised to accelerate down. General
Custer's last stand. They don't make charts that look worse than this.
Looks like an ideal short entry with a stop just above 31. Stoolie
leicaboy had this to say about KKD. "The triangle from January
looks like it's getting a little bottom-heavy - heading for 25? breakout
today?" Well, leica, Doc doesn't like betting against Homer Simpson,
and 25 doesn't look like it's in the cards at the moment, but it appears
the 10-13 week cycle is starting to head down. Support at 35 will bring in
short covering. Then there's more support at 32. If you do it, keep your
buy stops close, like 38 for starters. Henceforth and forevermore, if you would like to request a "stock o'der", please post your request in Dear Dr. Stool. If you have not already registered for the message board, please do so. The only required info is user name and password which you choose yourself, and your email address, which you can keep private by selecting the keep private option. Doc looks forward to featuring your ideas. We've had some good ones! Uncle Buck's Illness
Wow, if this is Uncle Buck's up phase, what happens when the intermediate
cycle turns down? Support at 108 may not last long. Golden Stool Cousin HUI is
basing. All short and intermediate cycle indicators are at or near
bottoming levels, and the long term cycle indicator remains almost flat at
extremely high levels. The gold stocks should stay in this range until the
indicators turn up. It looks like it will be at least a week, maybe
two. See you in Intraday Stool. Dr. Stepan N. Stool Let me know what you think on the Stool Pigeons Wire. Previous complete issue with all features Welcome To New Subscribers Welcome, and thank you for subscribing to the Anals of Stock Proctology. You may note some subtle differences in style now that this is no longer a free service. The perspective is still bearish, but it will have a more balanced approach than my message board ravings. You won't see me screaming "BUY" about anything except perhaps gold, but you will see stronger indications of areas and times when I think it might be a good idea to avoid being short. And I promise that I will lose my temper from time to time to keep you entertained! There's also a new feature, Doc's By Request Stock O' The Day. If you have a stock you're interested in, send an email to [email protected], naming the stock, and why you think Doc should look at it, in 25 words or less. 26 words, and you're disqualified! Those that look interesting, Doc will try to feature here within the next day or two. If you have suggestions about other features you'd like to see, send them along to [email protected]. Again, thanks for subscribing!
Explanation of Intraday Commentary-Build charts at http://www.livecharts.com. For custom time bars insert a comma after symbol and number of minutes, e.g. compx,90. This will give you a bar chart of the Nas with 90 minutes per bar. The one day cycle is usually most clear with 8 minute bars and 26/18 stochastics. It varies from day to day. Sometimes 6 minutes works best. Experiment to find the best fit for your trading style, and the market's dominant frequency at the time. The goal here is primarily to monitor the condition of the 8 and 13 day cycles. I typically use 90 minute bars with 26/18 stochastics for the 13 day cycle proxy on the indices during regular trading hours. Other cycles use 26/18 stochastics with the following: 8 days- 60 minute bars On the 24 hour futures charts, use a time per bar approximately 3 to 4 times the above number of minutes, to represent the cycles listed above. ABBREVIATIONS: cma: centered moving average |
|||||||||||||||||||||||||||||||||||||||||||||||||||||||||||||||||||||||||||||||||||||||||||||||||||||||||||||||

![[Most Recent XAU from www.kitco.com]](http://www.weblinks247.com/indexes/idx24_nasdaq_en_2.gif)
![[Most Recent XAU from www.kitco.com]](http://www.weblinks247.com/indexes/idx24_sp500_en_2.gif)
![[Most Recent Quotes from www.kitco.com]](http://kitconet.com/charts/metals/gold/t24_au_en_usoz_2.gif)
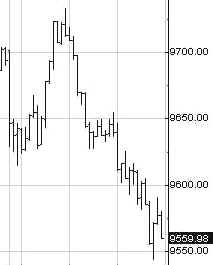
 Looking
at the 10 minute bar chart over in the left column we see that the stage
managers* shot the buying public a bird today. This formed one of Dr.
Stool's most famous rare chart patterns, The Finger, as in "Yo, d'you
jus' gimme da finger?" Boy, were those bulls who got the Finger ever
sorry late in the day, as the Dow plunged more than 170 points from the AM
high into the close.
Looking
at the 10 minute bar chart over in the left column we see that the stage
managers* shot the buying public a bird today. This formed one of Dr.
Stool's most famous rare chart patterns, The Finger, as in "Yo, d'you
jus' gimme da finger?" Boy, were those bulls who got the Finger ever
sorry late in the day, as the Dow plunged more than 170 points from the AM
high into the close.