|
Archives 12/30/01, 1/1/02, 1/2/02, 1/3/02, 1/4/02, 1/7/02, 1/8/02, 1/09/02, 1/10/02, 1/11/02, 1/14/02, 1/15/02, 1/16/02, 1/17/02, 1/18/02, 1/22/02, 1/23/02, 1/24/02, 1/25/02, 1/28/02, 1/29/02, 1/30/02, 1/31/02, 2/1/02, 2/4/02, 2/5/02, 2/06/02, 2/7/02, 2/9/02, 2/11/02, 2/12/02, 2/13/02, 2/14/02, 2/16/02, 2/19/02, 2/20/02, 2/21/02, 2/23/02, 2/25/02, 2/26/02, 2/27/02, 2/28/02, 3/1/02, 3/04/02, 3/05/02, 3/06/02, 3/7/02, 3/10/02,3/11/02, 3/12/02, 3/13/02, 3/14/02, 3/15/02, 3/18/02, 3/19/02, 3/20/02, 3/21/02, 3/22/02, 3/25/02, 3/26/02, 3/28/02, 3/30/02 4/1/02, 4/2/02, 4/3/02, 4/4/02, 4/6/02, 4/8/02, 4/9/02, 4/10/02, 4/11/02, 4/13/02, 4/15/02, 4/16/02, 4/17/02, 4/18/02, 4/20/02, 4/22/02, 4/23/02,4/24/02,4/25/02, 4/26/02, 4/27/02, 4/29/02, 4/30/02 5/01/02, 5/2/02, 5/4/02, 5/6/02, 5/07/02, 5/8/02, 5/09/02, 5/10/02, 5/13/02, 5/14/02, 5/15/02, 5/16/02, 5/17/02, 5/20/02, 5/21/02, 5/22/02, 5/23/02, 5/24/02, 5/28/02, 5/29/02, 5/30/02 6/01/02, 6/3/02, 6/4/02, 6/5/02, 6/6/02, 6/7/02, 6/10/02, 6/11/02, 6/12/02, 6/13/02, 6/14/02, 6/17/02, 6/18/02, 6/19/02, 6/20/02, 6/22/02, 6/24/02, 6/25/02, 6/26/02, 6/27/02, 6/30/02 7/1/02, 7/4/02, 7/5/02, 7/11/02, 7/14/02, 7/15/02, 7/16/02, 7/17/02, 7/18/02, 7/19/02, 7/22/02, 7/23/02, 7/24/02, 7/25/02, 7/27/02, 7/29/02, 7/30/02 8/1/02, 8/3/02, 8/5/02, 8/6/02, 8/7/02, 8/8/02, 8/10/02, 8/12/02, 8/13/02, 8/14/02, 8/15/02, 8/16/02, 8/19/02, 8/20/02, 8/21/02, 8/22/02, 8/23/02, 8/26/02, 8/27/02, 8/28/02, 8/29/02, 8/30/02 9/3/02, 9/4/02, 9/5/02. 9/6/02, 9/9/02, 9/10/02, 9/11/02, 9/12/02, 9/13/02, 9/16/02, 9/17/02, 9/18/02, 9/19/02, 9/20/02, 9/23/02, 9/24/02, 9/25/02, 9/26/02, 9/27/02, 9/30/02 10/1/02, 10/2/02, 10/3/02, 10/4/02, 10/7/02, 10/8/02, 10/9/02, 10/10/02, 10/11/02, 10/14/02, 10/15/02, 10/16/02, 10/17/02, 10/18/02, 10/21/02, 10/22/02, 10/23/02, 10/24/02, 10/25/02, 10/28/02, 10/29/02, 10/30/02, 10/31/02 11/1/02, 11/4/02, 11/5/02, 11/6/02, 11/7/02, 11/8/02, 11/11/02, 11/12/02, 11/13/02
|
The Anals of Stock ProctologyPublished weeknights by
8:30PM Happy Acres, Florida Time The American
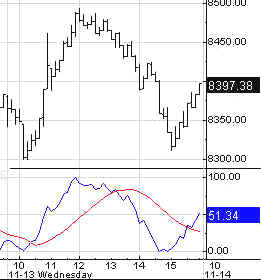
Academy of Stock Proctology and Is your subscription up for renewal? If you want to renew, do nothing, unless your credit card has expired. Please be sure your credit card info is current. If your credit card has expired, you must enter the new expiration date in your Paypal account in order for your subscription to be processed. If you subscribed via Paypal, your subscription will be renewed for one year on the 90 day anniversary of your sign-up and your credit card will be charged. If you want to cancel, use the button at the bottom of the page. This applies only if you subscribed through Paypal. Mailed-in subscriptions are for 1 year. If you subscribed by prior contribution, I will send you a notice before your subscription expires. If you have any questions, see the subscription page and FAQ's. If you can't find the answer, email me. Doc does not make trading recommendations. This update reports time cycle estimates and centered moving average projections based on the Hurst cycle analysis method. This publication is for entertainment and educational purposes only. Doc assumes no responsibility for the accuracy or inaccuracy of the estimates and projections presented. The market may or may not meet the projections. Stoolies should thoroughly familiarize themselves with the methodology before trading based on this method. Those who do not have the time or inclination to develop a trading strategy based on testing and research should not trade. Trade at your own risk. Yadda yadda. How's your motha? Mid Day Update 11/14/02 1 PM The 1 day cycle high is overdue. The cmap is 905. 5 and 8 day cycle cmaps are closer to 910. They could be hit tomorrow, after some churning this afternoon. A 5 hour high is due around 3 PM. Perhaps it will look something like this. All a little higher than we'd like, but no reason to panic....yet. 5-8 Day Cycle______ 2-3 Day Cycle_______ 5 Hr- 1 Day Cycle
Pre Market Outlook 11/14/02 9:15 AM Here we go again. The revised cycle map guess based on the fucutures is below. They'll make a run at 900. The 5 hour high is due at 10:30, give or take an hour. Look for a pullback, then a retest or reaction high at the 1 day cycle high due at noon +/-. 8 Day cycle cmap based on fucutures is 895-905, due any time over 3 days. 3 day cycle cmap is 900, due today or tomorrow. 5-8 Day Cycle______ 2-3 Day Cycle_______ 9-13 Hr Cycle_______ 5 Hr- 1 Day Cycle
Be a Johnny Applestool! Help spread the Stool! Feel free to repost snippets from the Anals on message boards around the web. Just give a link back! Many tanks - Doc The Really Big News (11/13/02) The market gyrated wildly on Wednesday, with little change in the end. Greenspewman was on Crapitol Hill, Osama's back, and Sodamn Insane said OK. But the only news that really mattered came from the Mortgage Bonkers Ass., its weekly Mo Gauge Applications Index. This one indicator tells us more about future liquidity trends than everything else in the world put together, even the Feed. Mortgage applications turn into mortgages in four to eight weeks. When those mortgages are bought and held by the GSE's in their own portfolios, they magically turn into money that shows up in the broad money supply numbers through the intermediation of money market funds. Doc won't get into the dirty details of the process. We have Doug Noland for that. It's the results that matter. In the beginning of October, MB II, the greatest mortgage bubble of all time, suddenly broke. If you don't think this had something to do with Al G's decision to cut the big one, think again. The mortgage bubble is the engine of the U.S. financial machine and the US economy. So long as it creates liquidity, the financial markets will keep their heads above water. The minute the machine stops, or even slows down, party over. Of course the markets themselves will tell us first when it's happening, but it sure helps to know what's going on with the two headed monster that creates the flatulence that keeps the bubble inflated. The mortgage machine is one of the heads. The other is Al's Feed. But the Feed may carry less weight. Last week, in spite of mortgage
rates dropping to their lowest levels since Adam and Eve, total mortgage
applications dropped. Even refi's, which should have
been goosed by the drop in rates, were down a bit. Perhaps more importantly,
purchase applications hit a 7 month low, breaking a year old uptrend line.
Any uptick in rates will send the housing bubble down the toilet, and the
entire financial house of cards may go with it. Is it any wonder that Fed
officials are talking out of both sides of their mouths? One day all the
governors are running around reporting that everything's peachy. The next
day Al's on the Hill telling the gummit that things look like crap and we
cut the big one to keep it from getting crappier. When the governors were
out touting on Tuesday, the bond market started to sell off. So Al had to
come out today and say, no, it really stinks, so that the bonds wouldn't
be spooked. They simply cannot afford to see rates uptick. They cannot
afford any sign of economic strength. Yes that seems counterintuitive. But
it's clear that rising long term rates at this point would be a big
problem with mortgage demand already weakening even as rates stay low. How all this will affect the stock market, Doc doesn't want to speculate. We let the market tell the tale. But if the system can't keep creating mo' money at a breakneck pace, the next sound you hear will be the giant whoosh of monetary implosion. And that's not a good thing. The Feed added a net of $750 million. They did $ 7 billion in overnight repos with $6.25 billion in 5 day repos expiring. $12 billion in one and two day repos expire Thursday, along with two billion in 28 day repos. That's a helluva wad to roll over. But they gotta do it. The banking system has a $40 billion bill due on Friday for the Treasury notes. That is not an Oreck XL you hear. The important thing is that even if there is a truly humongous Feed tomorrow, it is unlikely to help the stock market. In spite of the minor uptick, the Feed Index is not telling us that this is the start of a major reliquefaction. It's at the top of its neutral trend and maintains 8% growth over the last year. They're gonna have to do a lot more for a lot longer if they want to jam this market. There are just too many other claims on the money. Three
trends are evident on the Feed Index, which is the total Fed holdings of
loans and securities. One is the 10% growth trend beginning in May of
2001. Feed growth has recently been at or below the lower boundary of that
trend. The blue channel going back to last December suggests that Al may
now be targeting an 8% growth rate. Then there's the golden box which says
he's stopped growing Feed altogether over the last five months. The Feedometer has broken out of its short term downtrend, but not the intermediate one. With the giant rollover, and settlement on the notes due, what the Feed does Thursday could be the tell on their longer term intent. The
Feedometer theoretically
measures excess Feed available for bond or stock market jamming. Bond yields
dropped slightly. Short cycles are trying to head up, while the 10-13 week
cycle comes down. Cyclicality is mixed . Don't expect evidence of a new
trend for several months longer term cycles complete the bottoming
process.
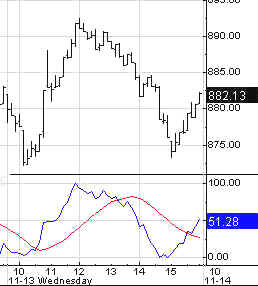
Intraday Outlook - Look for more of the same. Lots of motion with no sustained direction. The early going could be particularly choppy as both 1 day cycle low and a 5 hour cycle high are due within the first hour or so. The initial upside cmap for the 1 day high due at mid day looks like 886-888. The upside cmap on this 5 and 8 day day cycle swup is at about 891. At this point it looks unexceptional, but this week is more unpredictable than usual. Stay tuned for the pre market update around 9 AM. 5-8 Day Cycle______ 2-3 Day Cycle_______ 9-13 Hr Cycle_______ 5 Hr- 1 Day Cycle
All of Doc's
daily cycle charts are powered by METASTOCK Portfolio Sphincters Index (SPX) and Sentiment Sentiment and Momentum Indicators
The 17 day rate of change is a proxy for the
6-7 week cycle. the 29 day rate of change is a proxy for the 10-13 week
cycle. The dark blue overlaid line is the 10-13 week cycle
oscillator, while the red line is the 6-7 week cycle oscillator. The VIX
is a measure of implied options volatility reflecting relative fear or
complacency. It is plotted below on an inverse scale to better show the
relationship to the price chart. The "Stool Bands may reflect either
6 month or 10-12 month cycles. Short Term Cycles The 8-13 day cycles are in a weak up phase that should only last a couple of days. Normally, following an absolute high, we see a bounce or two to complete a distribution top. The 6-7 week cycle is in a sideways down phase that's due to end next week. It should limit the upside while in the down phase, but may allow for a pop of a few days when the cycle turns up next week or the week after. All in all, it should keep the market in this narrow range for a couple of weeks. By that time the charts should have a nice Hunchback formation with a weak right shoulder. 10-13 Week Cycle The "top of the top" of the 10-13 week cycle is complete, but there is work to do on the right side of the top. The 29 day rate of change has confirmed the turn. Perhaps two 8-13 day cycles should complete the distribution phase (giving the Hunchback two humps - the infamous Camel top). The cycle low is due in late December or early January. The balance of November looks sideways, then down in December. That would be the camel's tail. He'd be facing left and dropping right. VIX The chart above uses a method for depicting the Stool Bands which results in a smoother curve with a longer lag than what Doc had been using. Based on this method, it appears that the top in progress is significant. It is important to keep in mind that sentiment extremes follow the market's trend. They are not predictive in and of themselves. They give context to the price indicators and vice versa. Cycle Chart The Cycle Conditions tables include cycle phase and a wild guess as to number of periods to the next turn, in days for the shortest cycles, weeks (W) or months (M) for the longer ones. This is a fluid exercise, in other words, the projections are likely to be wrong, but they force us to be vigilant for key turning points, and frequently work well enough to prevent costly misreadings. SPX Cycle Conditions as of 11/13/02
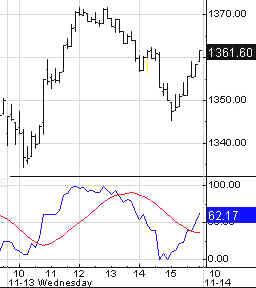
PTT - Periods Till Turn Nasgap Charts Cycle Chart Short Term Cycles It's still not nice to fool with Mother Nasty. The 8-13 day cycle is in an up phase. The preliminary upside cmap for the shortest cycles is 1365, and that was hit already. There doesn't appear to be much upside here. The 6-7 week cycle is in a sideways down phase that should keep a lid on things for a week or so. After that the 10-13 week cycle down phase should take over. But the next week or so should see a lot of churn as the top is built. 10-13 Week Cycle The 10-13 week cycle indicator is finally on a sell signal. Whipsaws happen, but this looks real promising. You are looking down from the top of a 350 point high descending major cycle channel. . 10-13 week cycle top phases can last for weeks, with breakdowns often delayed until the last 2-3 weeks in the cycle. They are marked by confusion, uncertainty, and lots of changes of direction. That may be the case here, but this is the time to start puttin' 'em on for the big sleigh ride into Xmas. Nasdaq Cycle Conditions as of 11/13/02
PTT
- Periods Till Turn Long Bong Hit - See top of page. AM Edition Features (Previous) These features are in morning edition, published between 7:30-8 AM ET US, or the Saturday Weak End Edition, published, uh, let's see, Saturday! Golden Stool The pullback
picked up steam after hitting the shorter cycles' cmap of 122 for a second
time. The 13 day cycle down phase has an outside cmap of 115 so far. At
this rate, the short cycle oscillator will be down to the bottom zone in
two or three days. 110 is long term support. Don't know if it will get
there, but it would be a buying zone if the ozzies are configured right.
Stay tuned. Uncle Buck's Illness Uncle B is in a short cycle recovery. It could last a few days or few weeks but the intermediate topping process will continue.
Suctor Watch and Stoolwethers- Now posted on separate page. Updated each morning between 8 AM and 9:30 AM NY time. See you in Intraday Stool. Dr. Stepan N. Stool Share your thoughts on the Stool Pigeons Wire.
Renewals Welcome, and thank you for subscribing to the Anals of Stock Proctology. Your trial subscription will run for 90 days. At the end of that period your subscription will renew automatically, unless you cancel. If you wish to cancel your subscription use the button below. If you want to renew your subscription do nothing. Your subscription will renew and your credit card or Paypal bank account will be charged. If you want to renew, be sure your credit card information in your Paypal account is current. Paypal will not renew your subscription if the card has expired! Again, thanks for subscribing!
Explanation of Intraday Commentary-Build charts at http://www.livecharts.com. For custom time bars insert a comma after symbol and number of minutes, e.g. compx,90. This will give you a bar chart of the Nas with 90 minutes per bar. The one day cycle is usually most clear with 8 minute bars and 26/18 stochastics. It varies from day to day. Sometimes 6 minutes works best. Experiment to find the best fit for your trading style, and the market's dominant frequency at the time. The goal here is primarily to monitor the condition of the 8 and 13 day cycles. I typically use 90 minute bars with 26/18 stochastics for the 13 day cycle proxy on the indices during regular trading hours. Other cycles use 26/18 stochastics with the following: 8 days- 60 minute bars On the 24 hour futures charts, use a time per bar approximately 3 to 4 times the above number of minutes, to represent the cycles listed above. ABBREVIATIONS: cma: centered moving average
|

![[Most Recent HUI from www.kitco.com]](http://www.weblinks247.com/indexes/idx24_hui_en_2.gif)
![[Most Recent XAU from www.kitco.com]](http://www.weblinks247.com/indexes/idx24_sp500_en_2.gif)
![[Most Recent Quotes from www.kitco.com]](http://kitconet.com/charts/metals/gold/t24_au_en_usoz_2.gif)