|
Archives 12/30/01, 1/1/02, 1/2/02, 1/3/02, 1/4/02, 1/7/02, 1/8/02, 1/09/02, 1/10/02, 1/11/02, 1/14/02, 1/15/02, 1/16/02, 1/17/02, 1/18/02, 1/22/02, 1/23/02, 1/24/02, 1/25/02, 1/28/02, 1/29/02, 1/30/02, 1/31/02, 2/1/02, 2/4/02, 2/5/02, 2/06/02, 2/7/02, 2/9/02, 2/11/02, 2/12/02, 2/13/02, 2/14/02, 2/16/02, 2/19/02, 2/20/02, 2/21/02, 2/23/02, 2/25/02, 2/26/02, 2/27/02, 2/28/02, 3/1/02, 3/04/02, 3/05/02, 3/06/02, 3/7/02, 3/10/02,3/11/02, 3/12/02, 3/13/02, 3/14/02, 3/15/02, 3/18/02, 3/19/02, 3/20/02, 3/21/02, 3/22/02, 3/25/02, 3/26/02, 3/28/02, 3/30/02 4/1/02, 4/2/02, 4/3/02, 4/4/02, 4/6/02, 4/8/02, 4/9/02, 4/10/02, 4/11/02, 4/13/02, 4/15/02, 4/16/02, 4/17/02, 4/18/02, 4/20/02, 4/22/02, 4/23/02,4/24/02,4/25/02, 4/26/02, 4/27/02, 4/29/02, 4/30/02 5/01/02, 5/2/02, 5/4/02, 5/6/02, 5/07/02, 5/8/02, 5/09/02, 5/10/02, 5/13/02, 5/14/02, 5/15/02, 5/16/02, 5/17/02, 5/20/02, 5/21/02, 5/22/02, 5/23/02, 5/24/02, 5/28/02, 5/29/02, 5/30/02 6/01/02, 6/3/02, 6/4/02, 6/5/02, 6/6/02, 6/7/02, 6/10/02, 6/11/02, 6/12/02, 6/13/02, 6/14/02, 6/17/02, 6/18/02, 6/19/02, 6/20/02, 6/22/02, 6/24/02, 6/25/02, 6/26/02, 6/27/02, 6/30/02 7/1/02, 7/4/02, 7/5/02, 7/11/02, 7/14/02, 7/15/02, 7/16/02, 7/17/02, 7/18/02, 7/19/02, 7/22/02, 7/23/02, 7/24/02, 7/25/02, 7/27/02, 7/29/02, 7/30/02 8/1/02, 8/3/02, 8/5/02, 8/6/02, 8/7/02, 8/8/02, 8/10/02, 8/12/02, 8/13/02, 8/14/02, 8/15/02, 8/16/02, 8/19/02, 8/20/02, 8/21/02, 8/22/02, 8/23/02, 8/26/02, 8/27/02, 8/28/02, 8/29/02, 8/30/02 9/3/02, 9/4/02, 9/5/02. 9/6/02, 9/9/02, 9/10/02, 9/11/02, 9/12/02, 9/13/02, 9/16/02, 9/17/02, 9/18/02, 9/19/02, 9/20/02, 9/23/02, 9/24/02, 9/25/02, 9/26/02, 9/27/02, 9/30/02 10/1/02, 10/2/02, 10/3/02, 10/4/02, 10/7/02
|
The Anals of Stock ProctologyPublished weeknights by
8:30PM Happy Acres, Florida Time The American Academy of Stock Proctology and Is your subscription up for renewal? If you want to renew, do nothing, unless your credit card has expired. Please be sure your credit card info is current. If your credit card has expired, you must enter the new expiration date in your Paypal account in order for your subscription to be processed. If you subscribed via Paypal, your subscription will be renewed for one year on the 90 day anniversary of your sign-up and your credit card will be charged. If you want to cancel, use the button at the bottom of the page. This applies only if you subscribed through Paypal. Mailed-in subscriptions are for 1 year. If you subscribed by prior contribution, I will send you a notice before your subscription expires. If you have any questions, see the subscription page and FAQ's. If you can't find the answer, email me. Update 10/9/02 1:00 PM Terms and methodology Cain't git it up. They came down pretty much as expected. OK, a little worse. The 1 day cycle low that was due at noon, came at 12:30, and the upturn is generating little enthusiasm. That leaves us in a kind of void, a no man's land. If they don't get traction, the next low would be on the next 5 hour cycle low due at 3 PM. The cmaps below are keyed on the assumption that the 5 hour cycle is topping out as of 1 PM. However, if they can hold the lows established at 12:30, then the 1 day cycle can swup until 3 PM. The last hour should be flat to weak. The 8 day cmaps indicate most of the damage has been done for this cycle. Could see a few days of respite. I will be out for the remainder of the afternoon.
Update 10/9/02 9:15 AM Terms and methodology Based on the late action yesterday, Doc was looking for some "backing down" into a Noon 1 day cycle low. With the sharp selloff in the fucutures this morning, it looks like the 5 hour low will be right after the open, at levels lower than what was projecting at the close yesterday. After the obligatory bounce, we may see lower lows at the 1 day cycle low due around mid day. The 8 day cmaps could be hit today. If we get a big Feed, look for another melt-up late in the day. If not, this could be a bottomless pit.
Doc does not make trading recommendations. This update reports intraday time cycle estimates and centered moving average projections based on the Hurst cycle analysis method. Doc assumes no responsibility for the accuracy or inaccuracy of these estimates and projections. The market may or may not meet these projections. New stoolies should thoroughly familiarize themselves with the methodology before trading based on this method. There is no free lunch. Those who do not have the time or inclination to develop a trading strategy based on testing and research should not trade. Trade at your own risk.
About Dads (and Moms too) (10/8/02) I have been fortunate to have never had to face the mortality of anyone in my immediate family. My grandparents passed on when I was too young to remember. My parents are still around. It was a string of luck which of course I knew would end. My Dad, Mom, and I got some bad news today. But I still count myself as fortunate. I am blessed that this kind, decent, quiet, and dignified man is my father, and that I will have him here for a little while longer. In the days ahead, I am gong to be spending more time with him, and just a bit less time working on Capitalstool. I deeply appreciate all the support I've gotten from all of you! I told Dad about all your prayers and healing wishes. He feels very honored. I feel honored too. Honored to be a part of our special community, and honored that Sid Adler is my Dad. I'd just like to remind you, that no matter how important trading the market may be in your life, NEVER let it interfere with that which is most important, your loved ones. Now, go give your spouses and kids a hug, and if your Mom and Dad are still around, give them a call to let them know you are thinking of them. Then go see them this weekend and give them a hug too. Do it for Doc. Lee Adler The Feed did nothing again today. There were no repos and no rollovers, yet again. The act of "no action" is, in effect, a tightening, because it fails to sustain the recent 8% growth rate, itself a downshift from 10% growth. No Feed, no jam. The rally was not fueled by Feed. Stocks instead moved in lockstep with bond yields throughout the day. In other words, portfolio shifting. The Feed Index is below the 8% growth channel, and is in the lower half of the no-growth channel. The big cap market did well today, so normally we wouldn't look for a big Feed, but Utilities got destroyed. We'll see if that's a trigger for a little Feed action. Three trends are evident on
the Feed Index. One is the 10% growth trend beginning in May of 2001. Feed
growth has recently been at or below the lower boundary of that trend. The
blue channel going back to last December suggests that Al may now be
targeting an 8% growth rate. Then there's the golden box which says he's stopped growing Feed altogether over the last three months. Lately, the Feedometer shows that Al is doing precious little to stabilize the market The Feedometer is now so far below its monthly average that we should expect some Feeding, but a really big Feed would be a shift from their recent stinginess. The
Feedometer theoretically
measures excess Feed available for bond or stock market jamming. 10 Year Bond yields were up a tick
at 3.64. Prices remain in a mid-channel consolidation. The 10-12 month cycle cmap is
3.65 and the 6 month cmap is 3.50,
also a long term resistance level. The intermediate cycle oscillator has
turned up, but it's too early to jump to conclusions. We need to see confirmation
from other indicators. Today's stock rally appeared to be fueled by
simultaneous bond liquidation which began at noon. A bit of an uptick in
bond yields should correspond with the next 10-13 week cycle up phase in
stocks. Financial and Economic Indicators October 3 Suctor Watch and Stoolwethers- Now posted on separate page. Updated each morning between 8 AM and 9:30 AM NY time.
All of Doc's
cycle charts
are powered by METASTOCK Portfolio Sphincters Index (SPX) and Sentiment Sentiment and Momentum
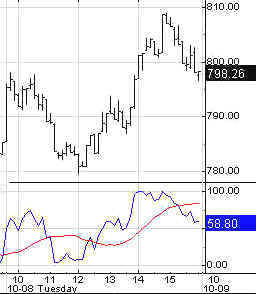
Indicators VIX The VIX dipped to 46.46, back to the center of the inverted scale 6 month cycle Stool Band. This indicator is still trending. The trend is likely to continue until the lower Stool Band is penetrated. Short Term Cycles The SPX again fell to near its lower channel boundary during the day, and then bounced to close near the trend center line. The lower channel boundary will be around 770 on Wednesday. The center line is approximately 800. The top of the channel is around 830. It's not ready to make the move through there, and could still head lower. The 6-7 week cycle phase is uncertain. It still has a tentative cmap of 730, due around the middle of next week. The 4 week cycle may also be ready to head lower. All really depends on the 10-13 week cycle, however. 10-13 Week Cycle The 10-13 week cycle indicator (dark blue line, above) again fell to a new bear market low. The 10-13 week low is due at any time within 11 days. This is the problem. A lot can happen in 11 days. The final phase of the decline is usually the sharpest, but the market could do a number of things, including simply churning sideways or lower. Since the indicators for this cycle haven't turned up, there's no point in trying to anticipate. They may be a little late at the turn, but at least we'll have some certainty. At the moment, we have plenty of uncertainty except for two things. The indicators haven't turned up, and the cmaps are still out there at 700 to 760. At this point, Doc would only consider shorting on intraday scalps based on the action of intraday indicators, and would be covering longer cycle swing trades on that basis as well, especially if we see a sharp break to the downside into the cmap range. After that it's time to take a breather. We can always reenter when conditions look more favorable. On the other hand, if you're a position trader and you've been short since last March or May, don't worry about it. Cycle Chart
Fiber Nacho Dump- Support levels and downside targets.
Fiber Nacho Reflux- Resistance levels and upside targets Long Term
(10/6/02) The six month cycle oscillator has not yet confirmed a downturn. This cycle is topping out a sideways up phase as it moves across the 2 year cycle channel. The weakness of the up phase and the amount of time left in the cycle suggest devastating losses through January. However, the descending lower trendline should be able to generate a 10-13 week cycle upturn within the next few weeks. Swing traders will want to cover at that point and look for re-entry after a rally. The 4 year cycle can be anywhere from 3 to 5 years in duration. The 1920's bubble wave lasted more than 6 years from initial launch to final bottom, with an interim low after the crash in November of 1929, a little more than 3 years after the onset of the bubble. The September 2001 low was at a similar point relative to the 1998 low. Think of the bubble wave like a tsunami. It is far bigger, longer lasting and far more destructive than the typical 4 year cycle. The 4 year cycle is barely an eddy in the tsunami wave. Given the 4 year cycle low in October 1998, certainly we need to be on the lookout for conditions indicating a four year cycle low. We also need to be aware that we may have already seen the low September 2001. (Hey the bulls were right! For 3 months.) Evidence of a 12 year cycle suggests that the final bear market low may not be seen until 2007. The Cycle Conditions tables include cycle phase and a wild guess as to number of periods to the next turn, in days for the shortest cycles, weeks (W) or months (M) for the longer ones. This is a fluid exercise, in other words, the projections are likely to be wrong, but they force us to be vigilant for key turning points, and frequently work well enough to prevent costly misreadings. SPX Cycle Conditions as of 10/8/02
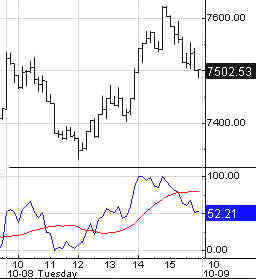
PTT - Periods Till Turn Nasgap Charts Cycle Chart Short Term Cycles The Nasty bumped up a little, remaining near the center of its short cycle downtrend channel. Short cycle cmaps upticked a bit, but they remain slightly below current levels. The 4 week cycle is a non-issue given the strength of the 10-13 week cycle down phase. The 6-7 week cycle is heading down again as evidenced by the 17 day rate of change and the short cycle oscillator. The cmap is 1020, due next week. Doc would put that in the "iffy" class. (Not the 1020, just that we'll see it on this cycle. 10-13 Week Cycle The 10-13 week cycle oscillator is still headed down. That has to be respected. The indicator has a record of timely signals. The same is true of the 29 day rate of change. The cmap is now 1010 to 1030, due within the 11 days. Longer cycle channel lines are projecting support between 1050 and 1100. These are usually pierced to some degree at key lows.
Fiber Nacho Dump- Support levels and downside targets.
Fiber Nacho Reflux- Resistance levels and upside targets Long Term (10/6/02) Confirmation of the 6 month
cycle sell signal will come when the smoother line (red), which is a time
series of the indicator line (navy), stops rising. Late signals are
usually a sign of a much bigger move to come. They happen when one phase
of a cycle is much shorter than typical, under the influence of
larger downtrending waves. The down phase of this cycle should last into
next year and carry well below 1000. The 2 year cycle trough is not due
until mid year, although the price low could come several months early or
late. This is a monthly chart with long term CMAPS. Measured on a percentage basis the projected low for the 4 year cycle is 1000. On a whole number basis, it's -500. That's negative 500. ( That's where the seller says, hey, I'll pay you 500 bucks to just tow it away.) The 8 year cycle projection is purely hypothetical and probably overly optimistic. Doc expects most companies on the Nasdaq to disappear. The ones that are left, probably only Mircroprice, and Farmer in the Dell, will have to go over to the NYSE.
Nasdaq Cycle Conditions as of 10/8/02
PTT
- Periods Till Turn AM Edition Features (Previous) These features are in morning edition, published around 9 AM ET US, or the Saturday Weak End Edition, published, uh, let's see, Saturday! Long Bong Hit - See top of page. Golden Stool- Published daily by 7:30 AM NY time The 13 day
cycle cmap now points at 108, and the 6-7 week cycle 106. That's the good
news. The bad news is that the 10-13 week cycle cmap is headed toward 102.
The worse than that news is that now the metal looks like it is starting
to roll over as well. But Doc still thinks it's just a correction and that
the 105 +/- area will hold and form an intermediate bottom. Uncle Buck's Illness- Published daily by 7:30 AM NY time
Buck's recovery continues. We need to be conscious that he's been a pretty
good leading indicator of the stock market, and pay close attention to any
break out of this trading range. Both the two longer cycles as well as the
short and intermediate cycle remain juxtaposed. Doc thinks that an upside
breakout is unlikely, but not impossible. Suctor Watch and Stoolwethers- Now posted on separate page. Updated each morning between 8 AM and 9:30 AM NY time. See you in Intraday Stool. Dr. Stepan N. Stool Share your thoughts on the Stool Pigeons Wire.
Renewals Welcome, and thank you for subscribing to the Anals of Stock Proctology. Your trial subscription will run for 90 days. At the end of that period your subscription will renew automatically, unless you cancel. If you wish to cancel your subscription use the button below. If you want to renew your subscription do nothing. Your subscription will renew and your credit card or Paypal bank account will be charged. If you want to renew, be sure your credit card information in your Paypal account is current. Paypal will not renew your subscription if the card has expired! Again, thanks for subscribing!
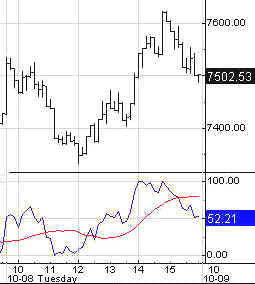
Explanation of Intraday Commentary-Build charts at http://www.livecharts.com. For custom time bars insert a comma after symbol and number of minutes, e.g. compx,90. This will give you a bar chart of the Nas with 90 minutes per bar. The one day cycle is usually most clear with 8 minute bars and 26/18 stochastics. It varies from day to day. Sometimes 6 minutes works best. Experiment to find the best fit for your trading style, and the market's dominant frequency at the time. The goal here is primarily to monitor the condition of the 8 and 13 day cycles. I typically use 90 minute bars with 26/18 stochastics for the 13 day cycle proxy on the indices during regular trading hours. Other cycles use 26/18 stochastics with the following: 8 days- 60 minute bars On the 24 hour futures charts, use a time per bar approximately 3 to 4 times the above number of minutes, to represent the cycles listed above. ABBREVIATIONS: cma: centered moving average
|
|||||||||||||||||||||||||||||||||||||||||||||||||||||||||||||||||||||||||||||||||||||||||||||||||||||||||||||||||||||

![[Most Recent HUI from www.kitco.com]](http://www.weblinks247.com/indexes/idx24_hui_en_2.gif)
![[Most Recent XAU from www.kitco.com]](http://www.weblinks247.com/indexes/idx24_sp500_en_2.gif)
![[Most Recent Quotes from www.kitco.com]](http://kitconet.com/charts/metals/gold/t24_au_en_usoz_2.gif)