|
Archives 12/30/01, 1/1/02, 1/2/02, 1/3/02, 1/4/02, 1/7/02, 1/8/02, 1/09/02, 1/10/02, 1/11/02, 1/14/02, 1/15/02, 1/16/02, 1/17/02, 1/18/02, 1/22/02, 1/23/02, 1/24/02, 1/25/02, 1/28/02, 1/29/02, 1/30/02, 1/31/02, 2/1/02, 2/4/02, 2/5/02, 2/06/02, 2/7/02, 2/9/02, 2/11/02, 2/12/02, 2/13/02, 2/14/02, 2/16/02, 2/19/02, 2/20/02, 2/21/02, 2/23/02, 2/25/02, 2/26/02, 2/27/02, 2/28/02, 3/1/02, 3/04/02, 3/05/02, 3/06/02, 3/7/02, 3/10/02,3/11/02, 3/12/02, 3/13/02, 3/14/02, 3/15/02, 3/18/02, 3/19/02, 3/20/02, 3/21/02, 3/22/02, 3/25/02, 3/26/02, 3/28/02, 3/30/02 4/1/02, 4/2/02, 4/3/02, 4/4/02, 4/6/02, 4/8/02, 4/9/02, 4/10/02, 4/11/02, 4/13/02, 4/15/02, 4/16/02, 4/17/02, 4/18/02, 4/20/02, 4/22/02, 4/23/02,4/24/02,4/25/02, 4/26/02, 4/27/02, 4/29/02, 4/30/02 5/01/02, 5/2/02, 5/4/02, 5/6/02, 5/07/02, 5/8/02, 5/09/02, 5/10/02, 5/13/02, 5/14/02, 5/15/02, 5/16/02, 5/17/02, 5/20/02, 5/21/02, 5/22/02, 5/23/02, 5/24/02, 5/28/02, 5/29/02, 5/30/02 6/01/02, 6/3/02, 6/4/02, 6/5/02, 6/6/02, 6/7/02, 6/10/02, 6/11/02, 6/12/02, 6/13/02, 6/14/02, 6/17/02, 6/18/02, 6/19/02, 6/20/02, 6/22/02, 6/24/02, 6/25/02, 6/26/02, 6/27/02, 6/30/02 7/1/02, 7/4/02, 7/5/02, 7/11/02, 7/14/02, 7/15/02, 7/16/02, 7/17/02, 7/18/02, 7/19/02, 7/22/02, 7/23/02, 7/24/02, 7/25/02, 7/27/02, 7/29/02, 7/30/02 8/1/02, 8/3/02, 8/5/02, 8/6/02, 8/7/02, 8/8/02, 8/10/02, 8/12/02, 8/13/02, 8/14/02, 8/15/02, 8/16/02, 8/19/02, 8/20/02, 8/21/02, 8/22/02, 8/23/02, 8/26/02, 8/27/02, 8/28/02, 8/29/02, 8/30/02 9/3/02, 9/4/02, 9/5/02. 9/6/02, 9/9/02, 9/10/02, 9/11/02, 9/12/02, 9/13/02, 9/16/02, 9/17/02, 9/18/02, 9/19/02, 9/20/02, 9/23/02, 9/24/02, 9/25/02, 9/26/02, 9/27/02, 9/30/02 10/1/02, 10/2/02, 10/3/02, 10/4/02
|
The Anals of Stock ProctologyPublished weeknights by
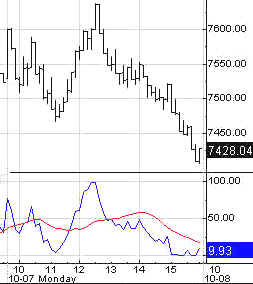
8:30PM Happy Acres, Florida Time The American Academy of Stock Proctology and Is your subscription up for renewal? If you want to renew, do nothing, unless your credit card has expired. Please be sure your credit card info is current. If your credit card has expired, you must enter the new expiration date in your Paypal account in order for your subscription to be processed. If you subscribed via Paypal, your subscription will be renewed for one year on the 90 day anniversary of your sign-up and your credit card will be charged. If you want to cancel, use the button at the bottom of the page. This applies only if you subscribed through Paypal. Mailed-in subscriptions are for 1 year. If you subscribed by prior contribution, I will send you a notice before your subscription expires. If you have any questions, see the subscription page and FAQ's. If you can't find the answer, email me. Doc will be traveling from October 10 to October 23. The Anals will be published on an irregular schedule during that time. Doc will stay in touch as much as practical, and will keep you posted in advance as to likely times of publication. You know what happens when Doc goes away!! (The "b" word.) Update 10/8/02 1:25 PM Terms and methodology We're seeing tremendous time compression, with huge up and down swings every 2.5 hours. The current upmove should be ending as I type this at 1:15 PM. The noon low looks like the second prong of a 1 day cycle low. The highs are coming approximately every 4 hours. So this may well be at the 1 day cycle high as well. In spite of the bouncing around, it still looks like the 8 day cycle cmaps will be hit in the next two days.
Update 10/8/02 9:15 AM Terms and methodology Last night Doc wrote that it looked like we would see a minor pop out of the gate this morning with a high around 11 AM. So far the futures are confirming that. A second high, for the 1 day cycle, may occur around 12:30 PM. However, in spite of the cheerleading from the Squawk Box crew, the fucutures topped out at 4 AM NY time and are in a down phase heading into the pre-market close. The averages may not make it to the projected cmaps, which are based on the earlier fucutures action. Doc is expecting lower lows later in the week.
Doc does not make trading recommendations. This update reports intraday time cycle estimates and centered moving average projections based on the Hurst cycle analysis method. Doc assumes no responsibility for the accuracy or inaccuracy of these estimates and projections. The market may or may not meet these projections. New stoolies should thoroughly familiarize themselves with the methodology before trading based on this method. There is no free lunch. Those who do not have the time or inclination to develop a trading strategy based on testing and research should not trade. Trade at your own risk.
The Depression Stage (10/7/02) The poodits are long past anger, long past denial, although there are still a few trotted out on Crapvision each day who insist on calling the bottom. For the most part, the tone is one of depressed resignation and relentless gloom. Bears, being worry warts, get most worried at just such times. We have been conditioned by the market over the past two and a half years to expect jams and rallies. We look for indications of too much fear, too much bearishness, too much Dover Sole. The enema of the shorts rears its ugly head every time the market stops declining. But the psychology is changing. The majority may finally be in the bearish camp. But it is not majorities which make bottoms. It is the last man who makes the bottom. In March of 2000, it was the very last buyer who made the top. In this bear market, it will be the very last seller who will make the bottom. The fact that the majority is now bearish, even though some may lie about it to the media, means that the rallies will be fewer and farther between. They will not last as long nor travel as far. There are few left who any longer want to buy , mostly just us shorts. But there are still plenty of sellers, and they have lots to sell. Remember how, during the bubble, the majority was bullish, but the market just kept going up, pausing to only go sideways for a few months from time to time. Well this is the opposite. It will be a long grind until the last bull. The Feed sat on its hands again today. There were no repos and no rollovers. The act of "no action" is, in effect, a tightening, since they have been targeting at least an 8% growth rate until the last few days. No Feed, no jam. The market is in danger of complete collapse without a large Feed soon. The massive draining last week is extraordinary because Feed was already growing slowly, while the market has been weak. This action supports what Doc has been saying for months. The Feed has cut the market loose to fend for itself. When will Sir Prints-a-lot step in to save the day? The Feed Index is below the 8% growth channel, and is in the lower half of the no-growth channel. Are they worried about inflation? If so, they may be barking at the wrong tree. We'll see. Three trends are evident on
the Feed Index. One is the 10% growth trend beginning in May of 2001. Feed
growth has recently been at or below the lower boundary of that trend. The
blue channel going back to last December suggests that Al may now be
targeting an 8% growth rate. Then there's the golden box which says he's stopped growing Feed altogether over the last three months. The fast Feedometer is the best evidence of the apparent tightening. The downtrend is accelerating. Al's modus operandi of late has been to add as little as necessary to stop a market meltdown, after it starts, then to take it back as soon as the market stabilizes. If ever there were a moment, this would be it. The Fed's inaction is striking. It's almost as if they have decided to hasten the purge. The
Feedometer theoretically
measures excess Feed available for bond or stock market jamming. 10 Year Bond yields were down 5
bp's at 3.63. Prices are now mid-channel. The 10-12 month cycle cmap is
3.65 and the 6 month cmap is 3.50 which is
also a long term resistance level. The intermediate cycle oscillator is
beginning to turn up, but it is not yet confirmed by other indicators. The trend is the trend until it isn't. Financial and Economic Indicators October 3 Suctor Watch and Stoolwethers- Now posted on separate page. Updated each morning between 8 AM and 9:30 AM NY time.
All of Doc's
cycle charts
are powered by METASTOCK Portfolio Sphincters Index (SPX) and Sentiment Long Term
(10/6/02) The six month cycle oscillator has not yet confirmed a downturn. This cycle is topping out a sideways up phase as it moves across the 2 year cycle channel. The weakness of the up phase and the amount of time left in the cycle suggest devastating losses through January. However, the descending lower trendline should be able to generate a 10-13 week cycle upturn within the next few weeks. Swing traders will want to cover at that point and look for re-entry after a rally. The 4 year cycle can be anywhere from 3 to 5 years in duration. The 1920's bubble wave lasted more than 6 years from initial launch to final bottom, with an interim low after the crash in November of 1929, a little more than 3 years after the onset of the bubble. The September 2001 low was at a similar point relative to the 1998 low. Think of the bubble wave like a tsunami. It is far bigger, longer lasting and far more destructive than the typical 4 year cycle. The 4 year cycle is barely an eddy in the tsunami wave. Given the 4 year cycle low in October 1998, certainly we need to be on the lookout for conditions indicating a four year cycle low. We also need to be aware that we may have already seen the low September 2001. (Hey the bulls were right! For 3 months.) Evidence of a 12 year cycle suggests that the final bear market low may not be seen until 2007. Sentiment and Momentum
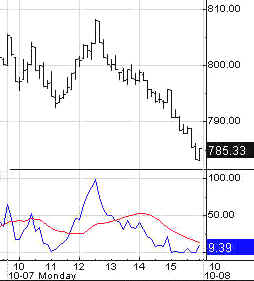
Indicators VIX The VIX rose to 49.18, still not extreme in terms of the inverted scale 6 month cycle Stool Band. This indicator, like the market, is trending, and this trend is likely to continue until the lower Stool Band is penetrated. Short Term Cycles The SPX dropped to near its lower channel boundary. The lower channel boundary will be 775 on Tuesday. It could try to bounce from there but the cmap is 745 on the 13 day cycle low due late this week. Any bounce should be transitory. The 6-7 week cycle may have turned down again. It has a tentative cmap of 730, due around the middle of next week. The 4 week cycle is a non-issue. 10-13 Week Cycle The 10-13 week cycle indicator again fell to a new bear market low. The 10-13 week low is due within 12 days. Indicators which look Dover Sole are often misleading, because there is no such thing as "over sold" in a bear market, especially this one. The final phase of the decline is usually the sharpest. In such cases Dover Sole can also mean continued collapse for a week or more. Doc believes nothing is to be gained by anticipating. It's better to wait for the signal. The cmap is 700 to 760. The cycle indicators have not flashed a turn signal. The trading stoolicator tried to turn but now appears to be headed lower again. The low end of the cmap range looks like a good bet over the next week or two. Cycle Chart
Fiber Nacho Dump- Support levels and downside targets.
Fiber Nacho Reflux- Resistance levels and upside targets Long Term
(10/6/02) The six month cycle oscillator has not yet confirmed a downturn. This cycle is topping out a sideways up phase as it moves across the 2 year cycle channel. The weakness of the up phase and the amount of time left in the cycle suggest devastating losses through January. However, the descending lower trendline should be able to generate a 10-13 week cycle upturn within the next few weeks. Swing traders will want to cover at that point and look for re-entry after a rally. The 4 year cycle can be anywhere from 3 to 5 years in duration. The 1920's bubble wave lasted more than 6 years from initial launch to final bottom, with an interim low after the crash in November of 1929, a little more than 3 years after the onset of the bubble. The September 2001 low was at a similar point relative to the 1998 low. Think of the bubble wave like a tsunami. It is far bigger, longer lasting and far more destructive than the typical 4 year cycle. The 4 year cycle is barely an eddy in the tsunami wave. Given the 4 year cycle low in October 1998, certainly we need to be on the lookout for conditions indicating a four year cycle low. We also need to be aware that we may have already seen the low September 2001. (Hey the bulls were right! For 3 months.) Evidence of a 12 year cycle suggests that the final bear market low may not be seen until 2007. The Cycle Conditions tables include cycle phase and a wild guess as to number of periods to the next turn, in days for the shortest cycles, weeks (W) or months (M) for the longer ones. This is a fluid exercise, in other words, the projections are likely to be wrong, but they force us to be vigilant for key turning points, and frequently work well enough to prevent costly misreadings. SPX Cycle Conditions as of 10/7/02
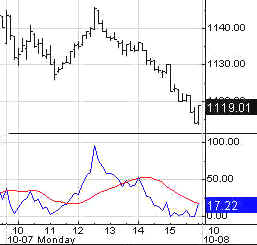
PTT - Periods Till Turn Nasgap Charts Cycle Chart Short Term Cycles The Nasty remains in an orderly downtrend. With no signs of panic yet, it's hard to see any pretext for a real bottom. The 13 day cycle has a few days to run and a revised downside cmap of 1055. The 8 day cycle may have hit a low, but it won't last long. The 4 week cycle is a non-issue given the strength of the 10-13 week cycle down phase. The 6-7 week cycle is heading down again as evidenced by the 17 day rate of change. The cmap is 1075, due next week. 10-13 Week Cycle The 10-13 week cycle is in its weakest zone. The initial crossover signal from the stoolicator normally comes 2-4 weeks before the final low. The cycle indicators remain in sharp downtrends. The cmap is now 980 to 1025, due within the 12 days.
Fiber Nacho Dump- Support levels and downside targets.
Fiber Nacho Reflux- Resistance levels and upside targets Long Term (10/6/02) Confirmation of the 6 month
cycle sell signal will come when the smoother line (red), which is a time
series of the indicator line (navy), stops rising. Late signals are
usually a sign of a much bigger move to come. They happen when one phase
of a cycle is much shorter than typical, under the influence of
larger downtrending waves. The down phase of this cycle should last into
next year and carry well below 1000. The 2 year cycle trough is not due
until mid year, although the price low could come several months early or
late. This is a monthly chart with long term CMAPS. Measured on a percentage basis the projected low for the 4 year cycle is 1000. On a whole number basis, it's -500. That's negative 500. ( That's where the seller says, hey, I'll pay you 500 bucks to just tow it away.) The 8 year cycle projection is purely hypothetical and probably overly optimistic. Doc expects most companies on the Nasdaq to disappear. The ones that are left, probably only Mircroprice, and Farmer in the Dell, will have to go over to the NYSE.
Nasdaq Cycle Conditions as of 10/7/02
PTT
- Periods Till Turn AM Edition Features (Previous) These features are in morning edition, published around 9 AM ET US, or the Saturday Weak End Edition, published, uh, let's see, Saturday! Long Bong Hit - See top of page. Golden Stool- Published daily by 7:30 AM NY time Continued weakness has now pushed the 10-13 week cycle cmap down to a potential 103. The market wide liquidity crunch sinks all boats. As Doc said yesterday, the long term trend will not be damaged, but there's plenty of pain.
Uncle Buck's Illness- Published daily by 7:30 AM NY time
The 10-12 month cycle can continue in this weak uptrend for months. Suctor Watch and Stoolwethers- Now posted on separate page. Updated each morning between 8 AM and 9:30 AM NY time. See you in Intraday Stool. Dr. Stepan N. Stool Share your thoughts on the Stool Pigeons Wire.
Renewals Welcome, and thank you for subscribing to the Anals of Stock Proctology. Your trial subscription will run for 90 days. At the end of that period your subscription will renew automatically, unless you cancel. If you wish to cancel your subscription use the button below. If you want to renew your subscription do nothing. Your subscription will renew and your credit card or Paypal bank account will be charged. If you want to renew, be sure your credit card information in your Paypal account is current. Paypal will not renew your subscription if the card has expired! Again, thanks for subscribing!
Explanation of Intraday Commentary-Build charts at http://www.livecharts.com. For custom time bars insert a comma after symbol and number of minutes, e.g. compx,90. This will give you a bar chart of the Nas with 90 minutes per bar. The one day cycle is usually most clear with 8 minute bars and 26/18 stochastics. It varies from day to day. Sometimes 6 minutes works best. Experiment to find the best fit for your trading style, and the market's dominant frequency at the time. The goal here is primarily to monitor the condition of the 8 and 13 day cycles. I typically use 90 minute bars with 26/18 stochastics for the 13 day cycle proxy on the indices during regular trading hours. Other cycles use 26/18 stochastics with the following: 8 days- 60 minute bars On the 24 hour futures charts, use a time per bar approximately 3 to 4 times the above number of minutes, to represent the cycles listed above. ABBREVIATIONS: cma: centered moving average
|
|||||||||||||||||||||||||||||||||||||||||||||||||||||||||||||||||||||||||||||||||||||||||||||||||||||||||||||||||||||

![[Most Recent HUI from www.kitco.com]](http://www.weblinks247.com/indexes/idx24_hui_en_2.gif)
![[Most Recent XAU from www.kitco.com]](http://www.weblinks247.com/indexes/idx24_sp500_en_2.gif)
![[Most Recent Quotes from www.kitco.com]](http://kitconet.com/charts/metals/gold/t24_au_en_usoz_2.gif)