|
Archives 12/30/01, 1/1/02, 1/2/02, 1/3/02, 1/4/02, 1/7/02, 1/8/02, 1/09/02, 1/10/02, 1/11/02, 1/14/02, 1/15/02, 1/16/02, 1/17/02, 1/18/02, 1/22/02, 1/23/02, 1/24/02, 1/25/02, 1/28/02, 1/29/02, 1/30/02, 1/31/02, 2/1/02, 2/4/02, 2/5/02, 2/06/02, 2/7/02, 2/9/02, 2/11/02, 2/12/02, 2/13/02, 2/14/02, 2/16/02, 2/19/02, 2/20/02, 2/21/02, 2/23/02, 2/25/02, 2/26/02, 2/27/02, 2/28/02, 3/1/02, 3/04/02, 3/05/02, 3/06/02, 3/7/02, 3/10/02,3/11/02, 3/12/02, 3/13/02, 3/14/02, 3/15/02, 3/18/02, 3/19/02, 3/20/02, 3/21/02, 3/22/02, 3/25/02, 3/26/02, 3/28/02, 3/30/02 4/1/02, 4/2/02, 4/3/02, 4/4/02, 4/6/02, 4/8/02, 4/9/02, 4/10/02, 4/11/02, 4/13/02, 4/15/02, 4/16/02, 4/17/02, 4/18/02, 4/20/02, 4/22/02, 4/23/02,4/24/02,4/25/02, 4/26/02, 4/27/02, 4/29/02, 4/30/02 5/01/02, 5/2/02, 5/4/02, 5/6/02, 5/07/02, 5/8/02, 5/09/02, 5/10/02, 5/13/02, 5/14/02, 5/15/02, 5/16/02, 5/17/02, 5/20/02, 5/21/02, 5/22/02, 5/23/02, 5/24/02, 5/28/02, 5/29/02, 5/30/02 6/01/02, 6/3/02, 6/4/02, 6/5/02, 6/6/02, 6/7/02, 6/10/02, 6/11/02, 6/12/02, 6/13/02, 6/14/02, 6/17/02, 6/18/02, 6/19/02, 6/20/02, 6/22/02, 6/24/02, 6/25/02, 6/26/02, 6/27/02, 6/30/02 7/1/02, 7/4/02, 7/5/02, 7/11/02, 7/14/02, 7/15/02, 7/16/02, 7/17/02, 7/18/02, 7/19/02, 7/22/02, 7/23/02, 7/24/02, 7/25/02, 7/27/02, 7/29/02, 7/30/02 8/1/02, 8/3/02, 8/5/02, 8/6/02, 8/7/02, 8/8/02, 8/10/02, 8/12/02, 8/13/02, 8/14/02, 8/15/02, 8/16/02, 8/19/02, 8/20/02, 8/21/02, 8/22/02, 8/23/02, 8/26/02, 8/27/02, 8/28/02, 8/29/02, 8/30/02 9/3/02, 9/4/02, 9/5/02. 9/6/02, 9/9/02, 9/10/02, 9/11/02, 9/12/02, 9/13/02, 9/16/02, 9/17/02, 9/18/02, 9/19/02, 9/20/02, 9/23/02, 9/24/02, 9/25/02
|
The Anals of Stock ProctologyPublished weeknights by
8:30PM Happy Acres, Florida Time The American Academy of Stock Proctology and Is your subscription up for renewal? If you want to renew, do nothing, unless your credit card has expired. Please be sure your credit card info is current. If your credit card has expired, you must enter the new expiration date in your Paypal account in order for your subscription to be processed. If you subscribed via Paypal, your subscription will be renewed for one year on the 90 day anniversary of your sign-up and your credit card will be charged. If you want to cancel, use the button at the bottom of the page. This applies only if you subscribed through Paypal. Mailed-in subscriptions are for 1 year. If you subscribed by prior contribution, I will send you a notice before your subscription expires. If you have any questions, see the subscription page and FAQ's. If you can't find the answer, email me. Doc will be interviewed late tonight on Marketviews.TV. The interview will be available there afterwards. Just look for the link. Many tanks to the shows host, Ike Iossif! Update 9/27/02 2:40 PM Terms and methodology Short cycles have melted down. The hard down phase in the 3 day cycle is in charge. Cmaps on this cycle are a minimum of 1195 on the Nas, SPX 825, and 860 on the NDX. Update 9/27/02 12:40 PM Terms and methodology OK, we got the chop. The 5 hour low should be in, but the 1 day low isn't due until 1:30. Something funny is going on with the Nas. It has stubbornly held on to its uptrend, thanks to end of quarter manipulation by the big Mu fu's. Screw them. This too shall pass. Rest of today, it doesn't look like there will be much movement. The downside is limited, and the peak appears to be in, but the 8 day cycle top phase isn't complete yet. Nas needs to do more work up here. Look for lows to form between 1:30 and 2, then an attempted recovery until 3PM. It could get ugly after that as the 3 day wave is in a hard down.
Update 9/27/02 9:00 AM Terms and methodology Unless the fucutures do something bizarre in the next few minutes, the 5 hour cycle top was in at the bell yesterday, as Doc suggested last night. Intraday cycles are juxtaposed, with the 5 hour cycle low due at 12 noon, versus the 1 day cycle up phase, the high of which would appear to be due at 11:30. Yesterday the 5 hour cycle was dominant. The 1 day cycle didn't show up at all. That's unusual. Doc expects it to reappear today. That would mean that after the initial selloff this morning, with a low in the first half hour, we should see a fairly strong reaction rally that lasts until 11-11:30, then another selloff into the lunch hour. In short, lots of churning, but no higher highs. The 8 day cycle high appears to be in, and the next 2-5 days should have a downward bias. It's too soon for a downside projection. It depends how weak today's action is. Doc hopes for more clarity in the PM.
Doc does not make trading recommendations. This update reports intraday time cycle estimates and centered moving average projections based on the Hurst cycle analysis method. Doc assumes no responsibility for the accuracy or inaccuracy of these estimates and projections. The market may or may not meet these projections. New stoolies should thoroughly familiarize themselves with the methodology before trading based on this method. There is no free lunch. Those who do not have the time or inclination to develop a trading strategy based on testing and research should not trade. Trade at your own risk.
Stoolonomics - Financial and Economic Indicator Review (9/26/02) Lots of pretty charts tonight, so foregoing the usual rant, without further adieu, Doc presents the Stoolonomics Review. The Feed added a net of $1.25 billion. They replaced $3 billion in expiring 28 day repos with only $2 billion. They then added $6.75 billion in overnight repos, while $4.5 billion were expiring. Overall this was a moderate addition and is consistent with the Feed's pumping phase. Had the market not been strong yesterday and this morning, no doubt we would have seen a bigger Feed. Still, this is a starvation diet. The patient will continue to gradually waste away. The $6.75 billion in overnight repos will expire Friday. The Fed has been gradually reducing the size of its 28 day repos. Doc is speculating that this may mean more day to day micro management. Total Feed continues to rise from the bottom of the 8% growth channel (blue), but remains well below the 10% growth channel. (green line) Normally when they start pumping off the bottom of the channel, they continue for a couple of days. But they also have a habit of backing off if the market has a strong day. We also see that the Feed line is still near the center of the no-growth channel. Three trends are evident on
the Feed Index. One is the 10% growth trend beginning in May of 2001. Feed
growth has recently been at or below the lower boundary of that trend. The
blue channel going back to last December suggests that Al may now be
targeting an 8% growth rate. Then there's the golden box which says he's stopped growing Feed altogether over the last three months. The Feedometer moved up again off the double bottom. "No change in Fed policy" means the Greenspam put is still there in an emergency. Other than that, there's no sign of Feed jamming. Once they start feeding a little, it usually continues for 2-3 days, then they reverse. They pump less when the market is up. The overall trend continues in a gradual tightening. The
Feedometer theoretically
measures excess Feed available for bond or stock market jamming. Bonds sold off again early, but made a comeback later in the day (Feed?). The 10 Year Bond Yield Index closed up a couple of ticks at 3.77. Long term cmaps on the 10 year yield are pointing anywhere from 3.30 to
3.60. A number of
conditions for a significant low are in place. They stretched the limits of the channels and
the turn was preceded by a classic parabolic panic. A close above 3.80
would confirm a turn in Doc's mind, although a retest of some kind should
be expected. Short term
cmaps for cycles up to 10-13 weeks pointed to a low of 3.60 and after
Wednesday's action a couple of short cycle oscillators turned up. We'll
know if the turn is for real after the next pullback. Money Money Money Money Time for our weekly review of the monetary indicators. Doc has been expecting the mortgage application boom to translate into booming growth in broad money supply as applications turn into loans. Applications were up last week, but did not make a new high. The volume remains phenomenal. The action is all in refis. Doc
has plotted mortgage rates on an inverse scale so that you can see the
sensitivity of the refi market to rate changes. At the same time, it's
clear that demand in the purchase market is not driven by mortgage rates.
It has stalled. The data from the Mortgage Bonkers Ass. is seasonally
adjusted. The fact that demand has been stagnant in the face of record low
interest rates is an ominous portent. What happens when this abnormal interest
subsidy goes away? Demand will dry up. The expected bulge in broad money
has only partly materialized. Money is also being destroyed, in part, by
the stock market decline. Derivatives problems are also playing a
role. The problem shows up in M1. Bank
accounts are not growing. Total deposits continue to stagnate, along with
the stock market and the economy. The commercial paper market is an ongoing disaster.
Bank lending has not picked up the
slack, and it made new lows in the most recent reporting week.. Even total bank credit had a rare
downtick. Plastic problems? Department of Yes We Have No Inflation Commodity prices are in a classic bullish trend, raising the specter that money supply growth is beginning to show up as generalized price inflation. Are commodity prices now extended,
or just completing a consolidation? The answer will be important to the performance
of the bond market. Last month, CPI was 4.1% on an annualized basis. Bond
yields now have a negative real rate of return. That could lead to a
vicious cycle of rising inflation and rising long term rates unless a
deflationary collapse intervenes.
All of Doc's
cycle charts
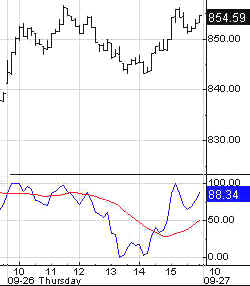
are powered by METASTOCK Portfolio Sphincters Index (SPX) and Sentiment The SPX rose into the upper half of its regression channel. The 17 day rate of change is on a buy signal, but the 29 day rate of change hasn't confirmed. Until both indicators are in gear, the market's not going far in either direction. The trend is your friend. When the 10-13 week cycle wave is coming down hard, the 6-7 week cycle becomes a non issue in the big picture, but it is still capable of generating a brief spike to the upside lasting a couple of days. Whether a 6-7 week cycle low is in or not is irrelevant if the 10-13 week cycle indicators are still heading down. Regardless, it pays to be prudent. There will be attempted shakeouts in both directions until the conflict is resolved. The superimposed 6-7 week cycle oscillator continues heading up, and the price action has followed. As the up phase goes on, the market's vulnerability to decline will increase regardless of whether prices rise or simply consolidate. That would be negated if the 10-13 week cycle indicator also turns up. Then it's bear trouble. The 10-13 week cycle oscillator is still declining. It should be 2 to 5 weeks before a cycle low, but the indicator is nearing the level of its previous upturn. We need to pay attention. If the indicator turns up, Doc would cover shorts, especially if the 6-7 week indicator were also headed up. The VIX fell sharply to
40.21. It's now back near the upper band of the inverted scale 6 month cycle Stool band.
A short term top would be signaled when the indicator
gets back into the upper band. The short cycle oscillator, (chart below) upticked, and is on a buy signal. This indicator tends to hit the "bottom line" at 4 or 6 week intervals, mimicking those cycles. This bounce looks a bit early in that context. Watch for a whipsaw. The 10-13 week cycle oscillator remains in a downtrend, and is still well above the 50% line, a double edged sword. There's room for a big drop still, but an upturn here would be big trouble for bears. The 6 month cycle indicator still has not topped out, meaning that the six month cycle is still in an up or top phase. The same goes for the 10-12 month cycle indicator. Under the circumstances we might see a series of frustrating bounces before the ultimate break down. The only upside projections are for very short cycles and they are essentially at current price levels. The preliminary downside cmap is 650 for the 6 month cycle low due in early 2003. The 10-13 week cycle cmap is 700, due some time in October.
Fiber Nacho Dump- Support levels and downside targets.
Fiber Nacho Reflux- Resistance levels and upside targets The Cycle Conditions tables include cycle phase and a wild guess as to number of periods to the next turn, in days for the shortest cycles, weeks (W) or months (M) for the longer ones. This is a fluid exercise, in other words, the projections are likely to be wrong, but they force us to be vigilant for key turning points, and frequently work well enough to prevent costly misreadings. SPX Cycle Conditions as of 9/26/02
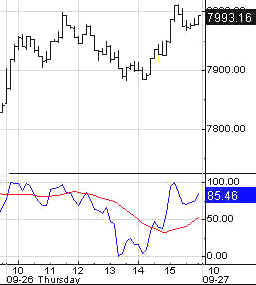
PTT - Periods Till Turn Nasgap Charts The Nas was driven back near the top of its short term cycle channel. The 17 day rate of change flashed a buy signal, however. This is not confirmed by the 29 day R.O.C. so it probably does not signal a sustainable rally. The short cycle oscillator also rose. It is a more sensitive, and less reliable indicator. Doc would not expect follow through unless the momentum indicators all get in gear. The 10-13 week cycle oscillator is in a configuration similar to the SPX. The same comments apply. The 6 month cycle indicator may have flashed a sell signal. Let's wait a couple days to see for sure. If the indicator does start to roll over, this should be the last rally in the top phase. The very preliminary indication for the January-February, 6 month cycle low is 1000. Whether the cmap moves up or down, or is cancelled, depends on the market's behavior over the next few days. The 4 week cycle is heading down in gear with the 10-13 week cycle. The power of the combined waves was creating a rip current that pulled everything with it. The up phase of the 13 day and 6-7 week cycles are fighting it, but it should be a losing battle. A big up day on Friday would abort that, however. In the absence of an extension of the rally Friday, the probability of a bigger rally within less than two weeks is low. As with the SPX, a series of up and down swings could occur before the expected breakdown. We saw similar action before the Dow broke key round number levels in the 73-74 bear market. The 10-13 week cycle projection is now 1025 due some time in October.
The stoolicator is a proxy for the dominant
trading cycle, either 6-7 or 10-13 weeks. The 17 day rate of change is a
proxy for the 6-7 week cycle. The 29 day rate of change is a proxy for
the 10-13 week cycle. The teal channel is the idealized 2 year
cycle. The light green channel is the idealized 10-12 month cycle. The
dark blue channel is the idealized 5-6 month cycle. The red channel is the
10-13 week cycle.
Fiber Nacho Dump- Support levels and downside targets.
Fiber Nacho Reflux- Resistance levels and upside targets Nasdaq Cycle Conditions as of 9/26/02
PTT
- Periods Till Turn AM Edition Features (Previous) These features are in morning edition, published around 9 AM ET US, or the Saturday Weak End Edition, published, uh, let's see, Saturday! Golden Stool The 6-7 week
cycle downside cmap is 122. If that doesn't hold, then we're looking at a
possible cmap if 106 on the 10-13 week cycle. One or the other will complete
the correction. Doc continues to believe that the gold stocks are in a
corrective phase that could last for up to 6 months, during which time HUI
should continue to trade in the range between 140, and the low reached in
the next few days. Uncle Buck's Illness
Uncle Buck will be confined to his room for the foreseeable
future. Aerospace- Takeoff attempt
should fail this time. Most stocks have this pattern- Short cycle turns up, with no confirmation for the 10-13 week cycle indicators, which are still down. All this action is in the context of the 6 month cycle still in a sideways up phase, or topping out. They should churn around current levels for a few days, then break down. Bonkers are typical of that
pattern. Biodrech- A little
stronger- If the 10-13 week cycle oscillator turns up, take your shorts
off. Tech stocks show the same indicator patterns, but they have already broken major levels formerly known as support. Their bounces are simply reactions, i.e. returns to the scene of the crime. SOX Soft Where While in some tech groups, there isn't even any short covering to drive a rally. Nutworkers - Stoolwethers The patter for most non-tech stocks is similar to what we seen in the suctors. Short cycle up phase off level formerly known as major support; 10-13 week cycle- down; 6 month cycle in sideways up phase, or early in top formation. Doc expects a breakdown after a several days of churning. It's also possible that the process of bouncing off the lows could go on for weeks before this sucker finally breaks down. Be patient. Here's a representative sampling. Citicorpse Gyp 'Em- General Custer General McClellan Fat Ass Wally's Market Maker Management Tech stocks have similar patterns, but with weaker longer term trends. Some have broken levels formerly known as support, others sit just above. Same prognosis- some bouncing around, ultimately followed by breakdown. Mr. Bill Tell Crisco Farmer In BM See you in Intraday Stool. Dr. Stepan N. Stool Share your thoughts on the Stool Pigeons Wire.
Renewals Welcome, and thank you for subscribing to the Anals of Stock Proctology. Your trial subscription will run for 90 days. At the end of that period your subscription will renew automatically, unless you cancel. If you wish to cancel your subscription use the button below. If you want to renew your subscription do nothing. Your subscription will renew and your credit card or Paypal bank account will be charged. If you want to renew, be sure your credit card information in your Paypal account is current. Paypal will not renew your subscription if the card has expired! Again, thanks for subscribing!
Explanation of Intraday Commentary-Build charts at http://www.livecharts.com. For custom time bars insert a comma after symbol and number of minutes, e.g. compx,90. This will give you a bar chart of the Nas with 90 minutes per bar. The one day cycle is usually most clear with 8 minute bars and 26/18 stochastics. It varies from day to day. Sometimes 6 minutes works best. Experiment to find the best fit for your trading style, and the market's dominant frequency at the time. The goal here is primarily to monitor the condition of the 8 and 13 day cycles. I typically use 90 minute bars with 26/18 stochastics for the 13 day cycle proxy on the indices during regular trading hours. Other cycles use 26/18 stochastics with the following: 8 days- 60 minute bars On the 24 hour futures charts, use a time per bar approximately 3 to 4 times the above number of minutes, to represent the cycles listed above. ABBREVIATIONS: cma: centered moving average
|
|||||||||||||||||||||||||||||||||||||||||||||||||||||||||||||||||||||||||||||||||||||||||||||||||||||||||||||||||||||

![[Most Recent HUI from www.kitco.com]](http://www.weblinks247.com/indexes/idx24_hui_en_2.gif)
![[Most Recent XAU from www.kitco.com]](http://www.weblinks247.com/indexes/idx24_sp500_en_2.gif)
![[Most Recent Quotes from www.kitco.com]](http://kitconet.com/charts/metals/gold/t24_au_en_usoz_2.gif)