|
10 Minute Bar Charts 5/31/02 Dow Jokes Inflatables
Archives 12/30/01, 1/1/02, 1/2/02, 1/3/02, 1/4/02, 1/7/02, 1/8/02, 1/09/02, 1/10/02, 1/11/02, 1/14/02, 1/15/02, 1/16/02, 1/17/02, 1/18/02, 1/22/02, 1/23/02, 1/24/02, 1/25/02, 1/28/02, 1/29/02, 1/30/02, 1/31/02, 2/1/02, 2/4/02, 2/5/02, 2/06/02, 2/7/02, 2/9/02, 2/11/02, 2/12/02, 2/13/02, 2/14/02, 2/16/02, 2/19/02, 2/20/02, 2/21/02, 2/23/02, 2/25/02, 2/26/02, 2/27/02, 2/28/02, 3/1/02, 3/04/02, 3/05/02, 3/06/02, 3/7/02, 3/10/02,3/11/02, 3/12/02, 3/13/02, 3/14/02, 3/15/02, 3/18/02, 3/19/02, 3/20/02, 3/21/02, 3/22/02, 3/25/02, 3/26/02, 3/28/02, 3/30/02 4/1/02, 4/2/02, 4/3/02, 4/4/02, 4/6/02, 4/8/02, 4/9/02, 4/10/02, 4/11/02, 4/13/02, 4/15/02, 4/16/02, 4/17/02, 4/18/02, 4/20/02, 4/22/02, 4/23/02,4/24/02,4/25/02, 4/26/02, 4/27/02, 4/29/02, 4/30/02 5/01/02, 5/2/02, 5/4/02, 5/6/02, 5/07/02, 5/8/02, 5/09/02, 5/10/02, 5/13/02, 5/14/02, 5/15/02, 5/16/02, 5/17/02, 5/20/02, 5/21/02, 5/22/02, 5/23/02, 5/24/02, 5/28/02, 5/29/02, 5/30/02
|
The Anals of Stock ProctologyPublished 5 times
per week by the American Academy of Stock Proctology and PM Update 6/3/02 1PM The market appears to be in a weak sideways up phase that began at 11 AM. It should end with a final rally attempt concluding by 3 PM and go out weak. The 5 day cycle appears to be in the early stages of a downleg that could last until Thursday, but it may be truncated by a sharp selloff into an 8 day cycle low tomorrow. Intraday cyclicality is really ornery lately. It's the big picture that matters now. It's just time for bears to just buckle up, grit our teeth, and just ride this thing down.
AM Update- 6/3/02 11:15 AM Buyers made a half hearted attempt on the open. The SPX cmaps were hit. Nas and NDX fell shy. At this point, the intraday cyclicality is not clear. The one day cycle ozzies are trying to turn up, but the downtrend is such that those signals could easily abort. What is clear is that there's not much buying interest in this market. Cmaps on this move are SPX 1042, Nas 1570, and NDX 1185. 5 day cmaps are SPX 1033, Nas 1550, and NDX 1145, all due later this week, and all subject to change. AM Update- 6/3/02 8:45 AM Fucutures were slightly higher at 8:30 AM NY time but they had been on the rise all night and were approaching a top. The indexes on the other hand were approaching 5 hour and 1 day cycle lows as the market closed Friday. Downside cmaps for the move in progress Friday afternoon were met. Some firmness can be expected this morning. The cmaps below are based on the fucutures action. The 5 day cycle appears to be topping out a sideways up phase, with the Friday's highs probably the highs for the cycle.
Volga Boatman (6/1/02) In a stunning PM turnaround, bears once again took control Friday. This time, even Dr. Stool, who is rarely surprised by a weak market, was totally taken aback. Short term cycle patterns suggested the market should have at least a weak bounce lasting a couple of days. The question now is, "Is that all there is?" From reading the financial infomercials around the web and watching a bit of crapvision, it's clear that yesterday's action has the bulls completely demoralized. Doc suspects that the dip buyers may finally be ready to curl up in the fetal position and go away for a few months. Cycle patterns are moving toward a configuration that is as bearish as any since at least September of 2000, which led to month after month of relentless declines. The Feed did $3.5 billion in weekend repos Friday. For the second day in a row, that was a drain, as $5.5 billion in overnight repos were expiring. Whenever the Fed overshoots, they take it all back within a few weeks, with devastating impact on the markets. A sane person can only wonder just what the hell Al's doin', but maybe the Feed just has bigger fish to fry. In this case it was making sure that the skids were greased for The Hoover Administration's gargantuan $27 Billion 2 Year Treasury Note auction on Wednesday. In the week leading up to the auction, the Feed stuffed $28 billion into the system. What a coincidence, huh? Then somehow, the auction ended up being $33 billion, and in another amazing coincidence, the Feed bought $6 billion of that for its own account. Let's see, $27 billion plus $6 billion is how much? This is how the Feed prints toilet paper, folks. Did the orders go out to the Gang of 22 that the $28 billion Feed in the preceding days should be used for making sure the Note auction was plenty oversubscribed? Or were they just plain too scared to use some of it to jam the stock market? The Gang knew damn well the Fed wouldn't cover all that repo money it after the auction, and they also knew damn well that the sheeple were in no mood to take the handoff in the stock market and run with the ball, what with those 800 pound bears facing them. It's clear from the picture below
that there was a giant Feed, but unlike recent such events, no jam. Most
of it was sucked up by the Treasury sale, and whatever was left over is
now being drained off. In this liquidity starved world, the stock market
is a primary source of ready cash. The problem is, the willingness of the
sheeple, and especially foreign capital, to supply the dough just isn't
there. Plus, we all know, the portfolio sphincters are fully
invested. While they may still be willing, the ability to do major
buying doesn't exist. Especially without the cooperation of the sheeple.
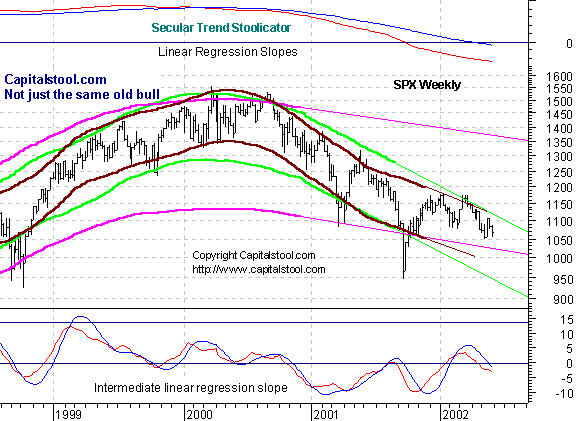
Portfolio Sphincters Index (SPX) and Sentiment On the weekly view, the lower band of the
secular trend projection looks like it will be broken on the next downleg.
Doc suspects the move will carry to the bottom of the 4 year channel
(green) by the fourth quarter. The SPX was up 2, which was a disaster considering the big gains early in the day. The 17 day rate of change, which represents the 6-7 week cycle still hasn't flashed a sell signal. But the 6-7 week cycle oscillator superimposed on the chart below (red line with purple smoother) did. It's not a strong signal yet. Another down day will do it. The 10-13 week cycle oscillator (teal) also appears to be topping out. The 29 day rate of change is in extremely precarious shape. One more down day will trigger a strong sell signal. Considering that the low is probably two months away, the losses are likely to be devastating. This is potentially the most bearish configuration since the bear market began, certainly at least as bad as the first quarter of 2001. The VIX dropped to 22.80. On the inverted scale chart, VIX is in the lower half of the stool band. Further trading in the 22-25 area will begin to turn that band down. It's a relatively low number indicating little fear among the options crowd. It is certainly nowhere near the level that would indicate an important rally. The blue channel lines are the extension of a linear
regression channel from the February and May 2001 highs. The 6 month cycle
oscillator is stalled in negative territory. The rise in the trading
stoolicator is also stalling in negative territory. A downturn from
this level would be very bearish. The short cycle oscillator is beginning to
bounce off the trampoline, but it won't matter if the springs are busted. The 10-13
week cycle oscillator
has turned flat. If the downturn comes
early and from low levels, that's extremely bearish. One more bounce wouldn't change much. The Bears dee-fence held at the Fiber Nacho 50
yard line, and moved back to the 24 yard line. Using a ball control
offense, they are driving for the score at 1050. The Cycle Conditions tables include cycle phase and a wild guess as to number of periods to the next turn, in days for the shortest cycles, weeks (W) or months (M) for the longer ones. This is a fluid exercise, in other words, the projections are likely to be wrong, but they force us to be vigilant for key turning points, and frequently work well enough to prevent costly misreadings. SPX Cycle Conditions as of 5/31/02
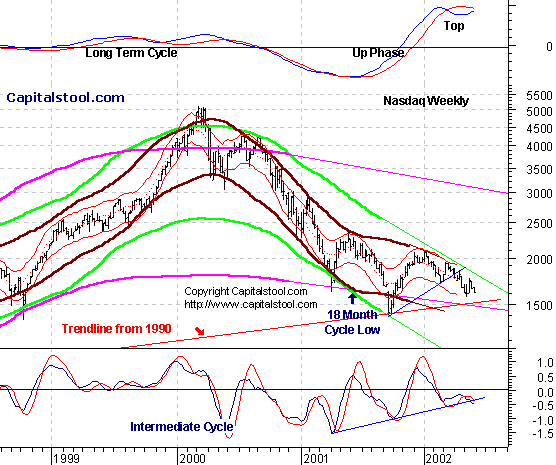
PTT - Periods Till Turn Nasgap Charts The
weekly chart raises the thought that as bad as things feel right now, they
are about to get much worse. Friday's
biggest disaster was the 16 point loss in the Nas after a strong morning. The old 6 month cycle oscillator
is beginning to downtick, signaling the end of the 6 month cycle up phase. (If that was the up phase,
what will the down look like?) The 6 month
time series spread points down. The 10-13 week cycle
oscillator and the trading stoolicator have stopped going up, and the
stoolicator is starting to roll over. The short
cycle is bouncing off the trampoline. Ooops, springs are busted. The 8-13 day cycle
looked like it had bottomed, but after that travesty on Friday, an
alternate scenario says it could drop into the mid 1500s next week. The
Nasgap 100 has already broken the long term cycle channel (teal)
projection. A second likely channel is superimposed on the chart. This index is headed for a breakdown which
should take out the September low. The Nasty
Bulls couldn't get past the Fiber Nacho 24 yard line. Bears are now
driving toward a score at 1562. Nasdaq Cycle Conditions as of 5/31/02
PTT
- Periods Till Turn The
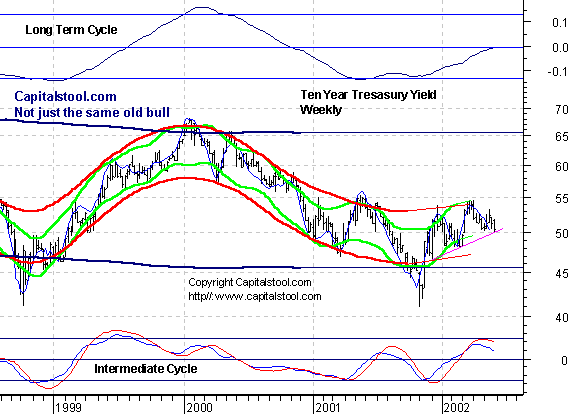
intermediate downtrend in yields should be coming to an end. But it could
run another month or two, in which case we'll see the 10 year back down to
4.70% concurrent with a stock market collapse. All part of a secular
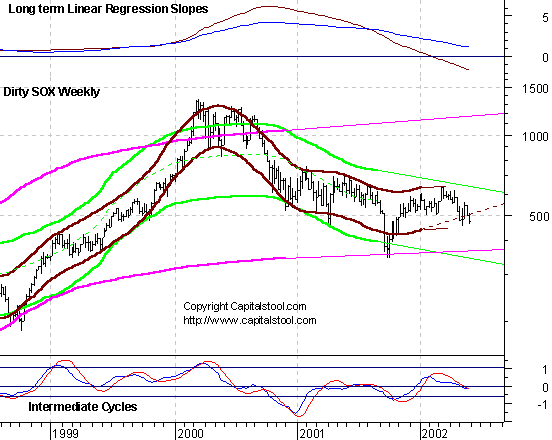
bottoming process in long term interest rates. Looking at dozens of sectors, most charts were recently neutral, but very close to sell signals. When this thing tips over, it looks like everything could break at the same time. The weekly dirty SOX shows
that the 12 to 18 month cycle has broken down, but hasn't yet established
a negative slope. The intermediate cycle oscillator is on the cusp of a
buy signal. Don't worry, that's a fakeout. The SOX are heading for the low
side of the 4 year cycle channel (green) around 380, and will probably
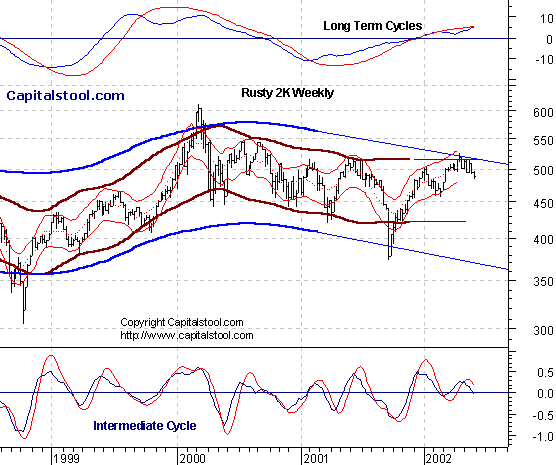
break it. The Rusty 2000 long term
chart makes one wonder why the portfolio sphincters are so bullish on the
small caps. Wait, what am I saying? They're "bullish" because
they are distributing. They're just talking bullish! This thing is
kaput, and is going to fall a long way once the ball gets rolling. The
long term oscillators are about due to roll over. Hey, there's a reason
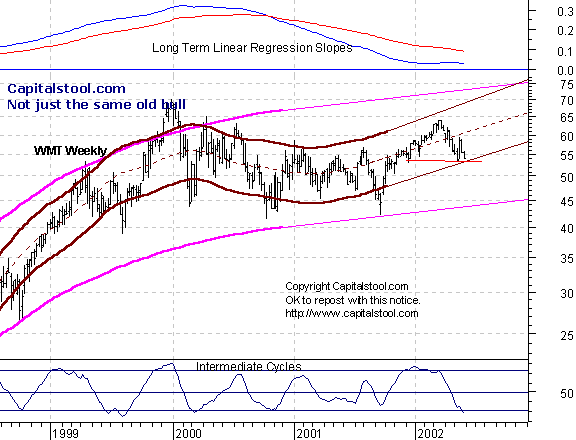
these companies are small. Wally's
Department Store - That 53 area is mighty strong support and the
intermediate cycle ozzie is almost on the trampoline. This may be the one
all the sphincters pour into when the stool hits the fan. More likely, it
will break this 6 month hunchback top and run down to 44 first. The daily
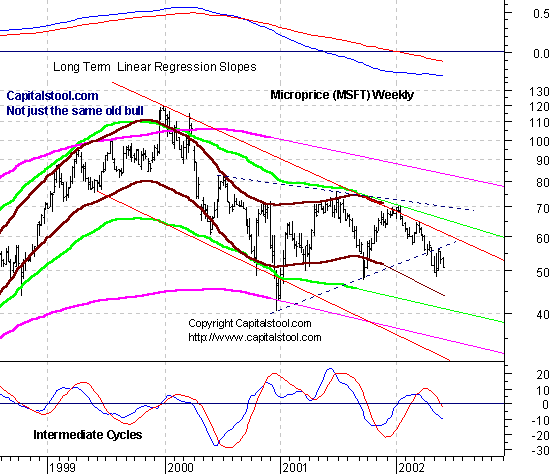
chart, not shown, says Wally's is headed for that breakdown. Microprice-
The judge is about to throw the book at the world's largest criminal
organization. Headed for the 30's by Labor Day. Untel -
Fleck did a number on this one in
his MSN column this weekend. Do we we have sell signals? Ooh, it's
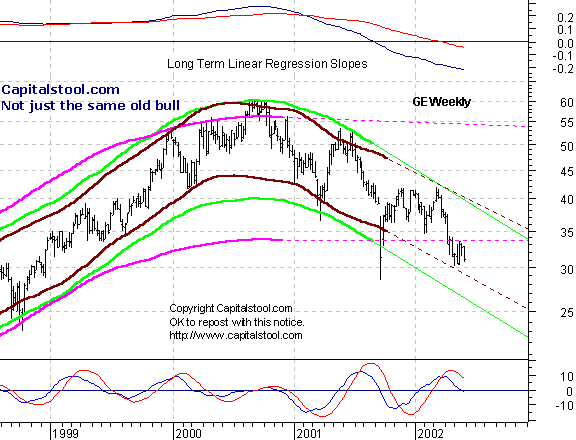
close! GE's headed
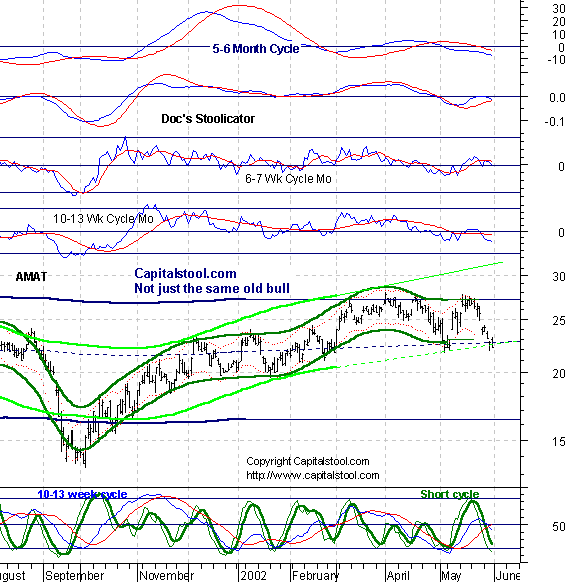
for 25. AMAT has a
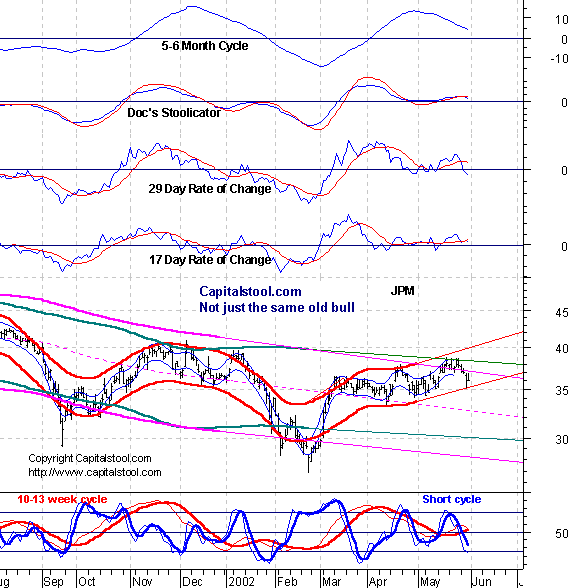
bead on 16 1/2. For all you JPM haters out there, is that a sell signal I spy on the stoolicator? 30 by the July 4 is my guess.
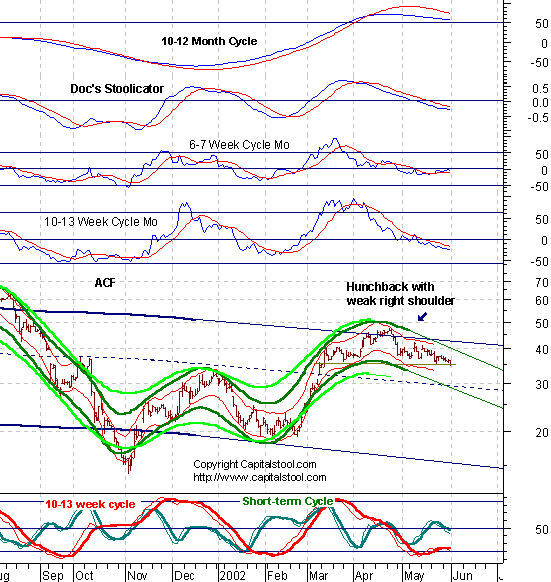
Is ACF ready to give it up?
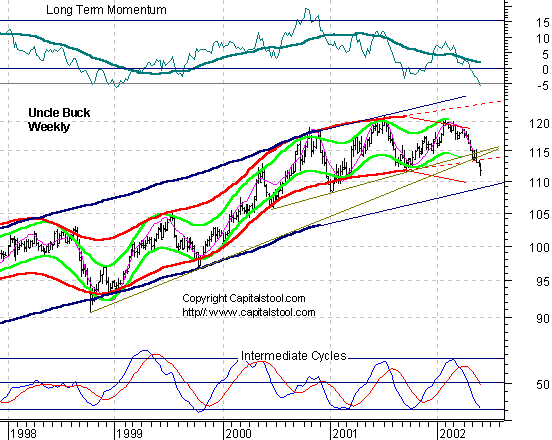
Doc thinks so. Uncle Buck's Illness Uncle Buck has
a date with a nurse in room 109. Should put some bounce back in his step.
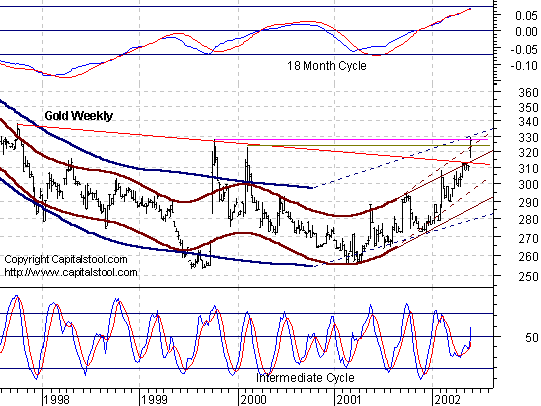
If not, he'll be headin' down to room 105. Golden Stool There
should be a load of resistance in the 330-332 area, but this is one
powerful uptrend. The oscillators say it's going to break out to the
upside and accelerate. See you in Intraday Stool. Dr. Stepan N. Stool Let me know what you think on the Stool Pigeons Wire. Previous complete issue with all features Welcome To New Subscribers Welcome, and thank you for subscribing to the Anals of Stock Proctology. You may note some subtle differences in style now that this is no longer a free service. The perspective is still bearish, but it will have a more balanced approach than my message board ravings. You won't see me screaming "BUY" about anything except perhaps gold, but you will see stronger indications of areas and times when I think it might be a good idea to avoid being short. And I promise that I will lose my temper from time to time to keep you entertained! There's also a new feature, Doc's By Request Stock O' The Day. If you have a stock you're interested in, send an email to [email protected], naming the stock, and why you think Doc should look at it, in 25 words or less. 26 words, and you're disqualified! Those that look interesting, Doc will try to feature here within the next day or two. If you have suggestions about other features you'd like to see, send them along to [email protected]. Again, thanks for subscribing!
Explanation of Intraday Commentary-Build charts at http://www.livecharts.com. For custom time bars insert a comma after symbol and number of minutes, e.g. compx,90. This will give you a bar chart of the Nas with 90 minutes per bar. The one day cycle is usually most clear with 8 minute bars and 26/18 stochastics. It varies from day to day. Sometimes 6 minutes works best. Experiment to find the best fit for your trading style, and the market's dominant frequency at the time. The goal here is primarily to monitor the condition of the 8 and 13 day cycles. I typically use 90 minute bars with 26/18 stochastics for the 13 day cycle proxy on the indices during regular trading hours. Other cycles use 26/18 stochastics with the following: 8 days- 60 minute bars On the 24 hour futures charts, use a time per bar approximately 3 to 4 times the above number of minutes, to represent the cycles listed above. ABBREVIATIONS: cma: centered moving average |
|||||||||||||||||||||||||||||||||||||||||||||||||||||||||||||||||||||||||||||||||||||||||||||||||||||||||||||||


![[Most Recent XAU from www.kitco.com]](http://www.weblinks247.com/indexes/idx24_nasdaq_en_2.gif)
![[Most Recent XAU from www.kitco.com]](http://www.weblinks247.com/indexes/idx24_sp500_en_2.gif)
![[Most Recent Quotes from www.kitco.com]](http://kitconet.com/charts/metals/gold/t24_au_en_usoz_2.gif)


 The
stage managers tried to put on a show Friday, but the audience walked out
at intermission. They apparently were not amused by the Dow Jokes humor.
It was a stunning turnaround, a picture of which you can see over in the
left hand column. The Number is beginning to look more and more like
resistance. Sellers have their asks just above The Number. Pretty soon
they will be just below. Then they'll start chasing them down.
The
stage managers tried to put on a show Friday, but the audience walked out
at intermission. They apparently were not amused by the Dow Jokes humor.
It was a stunning turnaround, a picture of which you can see over in the
left hand column. The Number is beginning to look more and more like
resistance. Sellers have their asks just above The Number. Pretty soon
they will be just below. Then they'll start chasing them down.