|
10 Minute Bar Charts 7/23/02 Dow Jokes Inflatables
Archives 12/30/01, 1/1/02, 1/2/02, 1/3/02, 1/4/02, 1/7/02, 1/8/02, 1/09/02, 1/10/02, 1/11/02, 1/14/02, 1/15/02, 1/16/02, 1/17/02, 1/18/02, 1/22/02, 1/23/02, 1/24/02, 1/25/02, 1/28/02, 1/29/02, 1/30/02, 1/31/02, 2/1/02, 2/4/02, 2/5/02, 2/06/02, 2/7/02, 2/9/02, 2/11/02, 2/12/02, 2/13/02, 2/14/02, 2/16/02, 2/19/02, 2/20/02, 2/21/02, 2/23/02, 2/25/02, 2/26/02, 2/27/02, 2/28/02, 3/1/02, 3/04/02, 3/05/02, 3/06/02, 3/7/02, 3/10/02,3/11/02, 3/12/02, 3/13/02, 3/14/02, 3/15/02, 3/18/02, 3/19/02, 3/20/02, 3/21/02, 3/22/02, 3/25/02, 3/26/02, 3/28/02, 3/30/02 4/1/02, 4/2/02, 4/3/02, 4/4/02, 4/6/02, 4/8/02, 4/9/02, 4/10/02, 4/11/02, 4/13/02, 4/15/02, 4/16/02, 4/17/02, 4/18/02, 4/20/02, 4/22/02, 4/23/02,4/24/02,4/25/02, 4/26/02, 4/27/02, 4/29/02, 4/30/02 5/01/02, 5/2/02, 5/4/02, 5/6/02, 5/07/02, 5/8/02, 5/09/02, 5/10/02, 5/13/02, 5/14/02, 5/15/02, 5/16/02, 5/17/02, 5/20/02, 5/21/02, 5/22/02, 5/23/02, 5/24/02, 5/28/02, 5/29/02, 5/30/02 6/01/02, 6/3/02, 6/4/02, 6/5/02, 6/6/02, 6/7/02, 6/10/02, 6/11/02, 6/12/02, 6/13/02, 6/14/02, 6/17/02, 6/18/02, 6/19/02, 6/20/02, 6/22/02, 6/24/02, 6/25/02, 6/26/02, 6/27/02, 6/30/02 7/1/02, 7/4/02, 7/5/02, 7/11/02, 7/14/02, 7/15/02, 7/16/02, 7/17/02, 7/18/02, 7/19/02, 7/22/02
|
The Anals of Stock ProctologyPublished weeknights by
8:30PM Happy Acres, Florida Time The American Academy of Stock Proctology and Is your subscription up for renewal? If you want to renew, do nothing, unless your credit card has expired. Please be sure your credit card info is current. If your credit card has passed its expiration date and you have received a new card, you must enter the new expiration date in your Paypal account in order for your subscription to be processed. If you subscribed via Paypal, your subscription will be renewed for one year on the 90 day anniversary of your sign-up and your credit card will be charged. If you want to cancel, use the button at the bottom of the page. This applies only if you subscribed through Paypal. Mailed-in subscriptions are for 1 year. If you subscribed by prior contribution, I will send you a notice before your subscription expires. If you have any questions, see the subscription page and FAQ's. If you can't find the answer, email me. PM Update 7/24/02 12:15 PM Terms and methodology Obviously, a quickly changing, dangerous market. The cycle timings have flip-flopped. The 12-1:30 time slot now looks like a high. Importantly, the downtrend has not yet been damaged. 1, 3 and 5 day cmaps to the upside appear to have already been hit. The 8 day cycle up phase is under way, but looks no better than a swup. I'm looking for a retest of the lows late today. But at this point all bets are off. Manipulation and market interference are the words of the day. I'm staying out until the picture is clearer. Doc does not make trading recommendations. This update reports intraday time cycle estimates and centered moving average projections based on the Hurst cycle analysis method. Doc assumes no responsibility for the accuracy or inaccuracy of these estimates and projections. The market may or may not meet these projections. New stoolies should thoroughly familiarize themselves with the methodology before trading based on this method. There is no free lunch. Those who do not have the time or inclination to develop a trading strategy based on testing and research should not trade. Trade at your own risk. On the other hand, if you made any extra this week on account of The Stool, send it in!
AM Update 7/24/02 10:45 AM Here are the revised projections. The market hit the revised one day cmaps on the first pass this morning, although we could get another dip into mid-day. The 8 day cycle cmaps have been revised upward, and have either been hit, or nearly hit. We are playing with fire here. Time to be on the sidelines. I wouldn't be shorting this rally. If I hadn't yet covered, I'd use the next 5 hour cycle down phase to do so.
AM Update 7/24/02 10:30 AM Based on the action so far, the cmaps posted below are about 5-10 points too low on the 1 day cycle, and about 20-25 points on the 8 day cycle. Means they are closer to a low than originally projected. We are in a dangerous window here with violent swings possible in both directions. AM Update 7/24/02 9:00 AM This morning's cmaps are based on the fucutures action just prior to 9:15. Not always reliable, but the closing action on the averages yesterday would understate the extent of the damage. The lows are due at noon and 1:30 PM on the 5 hour and 1 day cycles. The 8 day cycle low is overdue. If they hit these projections, I'd do some covering. Things smell awfully panicky today. Watch the market closely for signs of a turn as it reaches the cmaps. I'll be back here as the market warrants and will post a notice on intraday stool when an update is posted here.
That Fleeting Feeling (7/23/02) It all came apart again today. Those who thought the Nasdaq had made some kind of low were disappointed as the power of the trend reasserted itself in tech. This is an area where cyclic analysis is a big help. With conventional technical analysis it is usually impossible to tell if a price congestion area, like a triangle or pennant chart pattern, is a consolidation or a reversal. Using cyclic analysis, along with centered moving average projections, it was pretty clear that the Nasdaq was marking time while sellers shot down the stodgier names in the Dow Jokes and the Sphincters Index. Using cycle theory and the tools that go with it, Doc saw it as a sideways up phase that was bound to break down, and it did, with further to go. More on that below. Meanwhile, as Citicrap and JPM were getting rightfully crucified in the Senate and on the stock market, Doc reminds you to keep your eye on his favorite whipping post, FleetEnemaBank. This bank is of paramount importance to the health of the stock market. It's stock was down over 7% Tuesday. More importantly, on top of loan losses in Argentina, and its losses with the writeoff of Robbie Stephens (which it bought at the top of the market), the market is destroying its capital base. Coming soon will be news of its difficulties maintaining a market in the NYSE stocks for which it is the specialist and from which it has taken a terrific pounding the last few weeks. These include the following Dow stocks: Caterpillar
Inc. Fleet has taken a relentless pounding on these for months. They've been forced to buy stock in the relentless waves of selling, and have been unable to turn around and unload most of it at higher prices. They are choking on this stuff. Keep in mind they were also on the receiving end when Enron went down. Here are some more big names in their stable: Campbell Soup Company How much do you figure they lost on those couple hundred million shares of RD that were sold the last few days? Finally, they've had to support Williams all the way down from $45 to $1 this year, and Williams Energy Partners as it dropped from 35 to 25 today on 1.2 million shares. There is no way they could have been short enough stock to absorb this constant pounding in stock after stock after stock for the last year. For the rest of the Fleet horror story, here's the complete list. This, ladies and germs, is an accident waiting to happen. The Feed added $2 billion in overnight repost along with $530 million in a TIIS (inflation indexed bonds) pass. There were no rollovers. There are no expirations tomorrow. The Feed has begun the expected jam but so far it is surprisingly mild. Perhaps they don't want to waste the bullets. Here they have been increasing their paper holdings at a 10% annual rate for 1 1/2 years in an attempt to reflatulate the bubble economy, and, with the exception of the Treasury market, things just keep getting worse in the financial markets. And lest we forget this little notice from the US Treasury. Tomorrow..."the Treasury will auction $27,000 million of 2-year notes to refund $21,052 million of publicly held notes maturing July 31, 2002, and to raise new cash of approximately $5,948 million. In addition to the public holdings, Federal Reserve Banks hold $6,237 million of the maturing notes for their own accounts, which may be refunded by issuing an additional amount of the new security." So look for a big Feed tomorrow to
replace the $6 billion that will be sucked out of the system by the sale.
Watch also for an increase in the size of the auction, which will of
course be monetized by additional Fed purchases. Doc's comments below are the same as last night, in case you missed them: Last summer the Fed pumped for 2
1/2 months to no avail. Then after September 11 they opened the
flood gates. It took another two weeks for the market to turn. This summer
looks like a replay. Al's been feeding for two months, all for naught.
Expect the floodgates to open any day now. This time the catalyst won't be
a terrorist strike. This time it will be financial chaos. The problem now
is that the Feeding tubes, i.e. the Gang of 22 primary dealers, are almost
certainly themselves impaired. We are in a dangerous and unpredictable
situation.
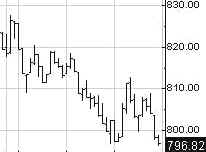
Portfolio Sphincters Index (SPX) and Sentiment The Sphincters Index tanked again, losing 22, to close at 797. In spite of that, cmaps firmed a bit for shorter cycles, up to the 760-90 range, but the 5-6 month cycle cmap still indicates a low in the low 700s within a few weeks. A line connecting the April and September 2001 lows is currently at 750. A break of that line could mark the selling climax of this move. The 17 day rate of change, which represents the 6-7 week cycle, dropped sharply again. It is now below its September low. The superimposed 6-7 week cycle oscillator (red) also dropped sharply, and it is nearing levels indicating a cycle low. Another day like today would put the indicator at that level. The 29 day rate of change fell below the September low. That indicator is not constrained. It can fall farther. It should should stabilize and turn up ahead of price when the 10-13 week cycle turns. The 10-13 week cycle oscillator (navy) broke to another new low for this move. All momentum based indicators remain in gear to the downside. The VIX finally broke 50, rising to 50.48. At a major low, extreme fear readings normally persist for several days. A buy signal is generated when the index drops below the blue band and then reverses. Look back at the September low, when VIX remained outside the channel for 5 days before reversing. Now that it has reached the outer Stool Band, we should start looking for a turn, but the problem is that we don't know how high is high (low on the chart), in terms of the final extreme in VIX, or any other sentiment indicator. There is no absolute limit, and historical levels do not apply. The chart should be read just as you would a stock price chart. The trend is your friend. The blue channel lines are the extension of a linear
regression channel from the September 2000 and March 2002 highs. The 6 month cycle
oscillator and the trading
stoolicator are accelerating down. The short cycle oscillator dropped
sharply again and is near a cycle bottom. The problem is that the
structure of this indicator is such that an upturn might only indicate a
slowing in the downtrend. The oscillator is relative to the trend slope. A
significant bounce is is still not a sure thing yet.
The 10-13 week cycle oscillator is also falling at a moderate pace
and, while it is in a bottom zone, it would need to turn up sharply to
indicate anything other than a slowing of the downtrend. There is still no sign of an upturn
in the market. The next fiber nacho
dump level is 750-60. That is also the logical stopping point because it
is on the line connecting the April and September 2001 lows. The Cycle Conditions tables include cycle phase and a wild guess as to number of periods to the next turn, in days for the shortest cycles, weeks (W) or months (M) for the longer ones. This is a fluid exercise, in other words, the projections are likely to be wrong, but they force us to be vigilant for key turning points, and frequently work well enough to prevent costly misreadings. SPX Cycle Conditions as of 7/23/02
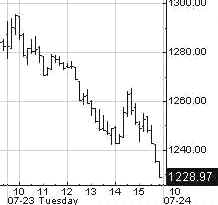
PTT - Periods Till Turn Nasgap Charts After breaking down out of the sideways up phase yesterday, the decline accelerated. The Nasty nose-dived nearly 54 points, a crushing 4% loss, surprising those who thought the index had put in a low, but not those who applied cycle theory. It was clear that the Nas had been in a sideways up phase that would be resolved to the downside. The trading range between 1350 and 1450 was a consolidation, and may only be the midpoint of this trend. We'll see. The
10-13 week cycle oscillator is beginning to roll over again, and has a lot
of room to drop. The short cycle oscillator is getting to bottoming levels,
but that might mean little, as explained above. Cmaps now point to lows of
1130-1140, with shorter cycle lows at higher levels. The 5-6 month cycle cmap
now as low as 1050, due any time in the next few weeks. Doc thinks it will
get there, but we have to let the market tell us its status on a day to
day basis. 1235-45
was an important fiber nacho barf level. It lasted all of about two hours.
The next level down is... Ok, let's face it. This market has no support. Nasdaq Cycle Conditions as of 7/23/02
PTT
- Periods Till Turn AM Edition Features (Previous) These features are in morning edition, published around 9 AM ET US, or the Saturday Weak End Edition, published, uh, let's see, Saturday!. The downturn in the
oscillators tells us that bond yields are going lower, with a retest of
the October lows in sight. Not only flight to quality but deflation is
also in the wind. The dirty
SOX are breaking down from a sideways up phase. This move looks like it is
just starting. Doc doesn't expect the long term channel projection to
hold. Financials-
This is a crash. Energy-
Crash. Everything else is the same as yesterday. Just lower. Doc is
speechless.
CSCO-
breakdown imminent.
This is a
swup in INTC. It will tank again. Same with
IBM. It's going to break down the channel projection.
Henceforth and forevermore, if you would like to request a "stock o'der", please post your request in Dear Dr. Stool. If you have not already registered for the message board, please do so. The only required info is user name and password which you choose yourself, and your email address, which you can keep private by selecting the keep private option. Doc looks forward to featuring your ideas. We've had some good ones! Uncle Buck's Illness
The turn in Uncle Buck appears to be very much for real. I use the term
"appears" because we all know this is subject to
"non-market" forces, which may temporarily create a false
impression. Therefore, in spite of the confirming turns in the
oscillators, let's wait awhile before reaching any conclusions. So far
this morning, Buck is off about .40. Golden Stool Are the gold
stocks still in a long term uptrend? Cousin Hui needs to hold above 100.
The only sign that it may is that the oscillators are Dover Sole. Not much
to hang your hat on. Doc is kicking himself for not giving weight to those
sell signals two weeks ago, and the rollover in the 10-12 month cycle
oscillator in the beginning of June. Surprise surprise, this stuff works.
Shame on Doc! Now he's holdin' and hopin' just like the bools. This is the
payback for getting "religious" about any sector. See you in Intraday Stool. Dr. Stepan N. Stool Let me know what you think on the Stool Pigeons Wire. Renewals Welcome, and thank you for subscribing to the Anals of Stock Proctology. Your trial subscription will run for 90 days. At the end of that period your subscription will renew automatically, unless you cancel. If you wish to cancel your subscription use the button below. If you want to renew your subscription do nothing. Your subscription will renew and your credit card or Paypal bank account will be charged. Again, thanks for subscribing!
Explanation of Intraday Commentary-Build charts at http://www.livecharts.com. For custom time bars insert a comma after symbol and number of minutes, e.g. compx,90. This will give you a bar chart of the Nas with 90 minutes per bar. The one day cycle is usually most clear with 8 minute bars and 26/18 stochastics. It varies from day to day. Sometimes 6 minutes works best. Experiment to find the best fit for your trading style, and the market's dominant frequency at the time. The goal here is primarily to monitor the condition of the 8 and 13 day cycles. I typically use 90 minute bars with 26/18 stochastics for the 13 day cycle proxy on the indices during regular trading hours. Other cycles use 26/18 stochastics with the following: 8 days- 60 minute bars On the 24 hour futures charts, use a time per bar approximately 3 to 4 times the above number of minutes, to represent the cycles listed above. ABBREVIATIONS: cma: centered moving average |
|||||||||||||||||||||||||||||||||||||||||||||||||||||||||||||||||||||||||||||||||||||||||||||||||||||||||||||||||||||||||||||||||||||||||||||||||||

![[Most Recent XAU from www.kitco.com]](http://www.weblinks247.com/indexes/idx24_nasdaq_en_2.gif)
![[Most Recent XAU from www.kitco.com]](http://www.weblinks247.com/indexes/idx24_sp500_en_2.gif)
![[Most Recent Quotes from www.kitco.com]](http://kitconet.com/charts/metals/gold/t24_au_en_usoz_2.gif)
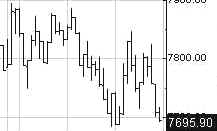
 The
Dow lost "only" 82 while closing under 7700. Keep in mind that
82 points today is a lot more than 82 points in March. It's now more than
1%.
The
Dow lost "only" 82 while closing under 7700. Keep in mind that
82 points today is a lot more than 82 points in March. It's now more than
1%.