|
Archives 12/30/01, 1/1/02, 1/2/02, 1/3/02, 1/4/02, 1/7/02, 1/8/02, 1/09/02, 1/10/02, 1/11/02, 1/14/02, 1/15/02, 1/16/02, 1/17/02, 1/18/02, 1/22/02, 1/23/02, 1/24/02, 1/25/02, 1/28/02, 1/29/02, 1/30/02, 1/31/02, 2/1/02, 2/4/02, 2/5/02, 2/06/02, 2/7/02, 2/9/02, 2/11/02, 2/12/02, 2/13/02, 2/14/02, 2/16/02, 2/19/02, 2/20/02, 2/21/02, 2/23/02, 2/25/02, 2/26/02, 2/27/02, 2/28/02, 3/1/02, 3/04/02, 3/05/02, 3/06/02, 3/7/02, 3/10/02,3/11/02, 3/12/02, 3/13/02, 3/14/02, 3/15/02, 3/18/02, 3/19/02, 3/20/02, 3/21/02, 3/22/02, 3/25/02, 3/26/02, 3/28/02, 3/30/02 4/1/02, 4/2/02, 4/3/02, 4/4/02, 4/6/02, 4/8/02, 4/9/02, 4/10/02, 4/11/02, 4/13/02, 4/15/02, 4/16/02, 4/17/02, 4/18/02, 4/20/02, 4/22/02, 4/23/02,4/24/02,4/25/02, 4/26/02, 4/27/02, 4/29/02, 4/30/02 5/01/02, 5/2/02, 5/4/02, 5/6/02, 5/07/02, 5/8/02, 5/09/02, 5/10/02, 5/13/02, 5/14/02, 5/15/02, 5/16/02, 5/17/02, 5/20/02, 5/21/02, 5/22/02, 5/23/02, 5/24/02, 5/28/02, 5/29/02, 5/30/02 6/01/02, 6/3/02, 6/4/02, 6/5/02, 6/6/02, 6/7/02, 6/10/02, 6/11/02, 6/12/02, 6/13/02, 6/14/02, 6/17/02, 6/18/02, 6/19/02, 6/20/02, 6/22/02, 6/24/02, 6/25/02, 6/26/02, 6/27/02, 6/30/02 7/1/02, 7/4/02, 7/5/02, 7/11/02, 7/14/02, 7/15/02, 7/16/02, 7/17/02, 7/18/02, 7/19/02, 7/22/02, 7/23/02, 7/24/02, 7/25/02, 7/27/02, 7/29/02, 7/30/02 8/1/02, 8/3/02, 8/5/02, 8/6/02, 8/7/02, 8/8/02, 8/10/02, 8/12/02, 8/13/02, 8/14/02, 8/15/02, 8/16/02, 8/19/02, 8/20/02, 8/21/02, 8/22/02, 8/23/02, 8/26/02, 8/27/02, 8/28/02, 8/29/02, 8/30/02 9/3/02, 9/4/02, 9/5/02. 9/6/02, 9/9/02, 9/10/02, 9/11/02, 9/12/02, 9/13/02, 9/16/02, 9/17/02, 9/18/02, 9/19/02, 9/20/02
|
The Anals of Stock ProctologyPublished weeknights by
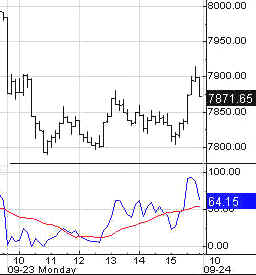
8:30PM Happy Acres, Florida Time The American Academy of Stock Proctology and Is your subscription up for renewal? If you want to renew, do nothing, unless your credit card has expired. Please be sure your credit card info is current. If your credit card has expired, you must enter the new expiration date in your Paypal account in order for your subscription to be processed. If you subscribed via Paypal, your subscription will be renewed for one year on the 90 day anniversary of your sign-up and your credit card will be charged. If you want to cancel, use the button at the bottom of the page. This applies only if you subscribed through Paypal. Mailed-in subscriptions are for 1 year. If you subscribed by prior contribution, I will send you a notice before your subscription expires. If you have any questions, see the subscription page and FAQ's. If you can't find the answer, email me. Update 9/24/02 12:45 PM Terms and methodology Intraday cycles are a bit messed up but not much changed in spite of that annoying early jam. The 5 hour and 1 day cycle timing is uncertain. The 12:30 low looks like a 3 hour wavelet. That would put the 5 hour low after the Fed announcement due at 2:15. Of course anything goes today, but so far the cmaps have held. There's a real problem on the 5, 8, and 13 day cmaps. The market is trending over this time frame. Look at an hourly bar chart, and you'll see the averages trading down in virtually a straight line channel. The 5 and 8 day cmaps are the higher number and the 13 day cmap is the lower target. It could be hit today or tomorrow, or the market could bounce from current levels. If the higher cmaps break, look to the lower ones.
Update 9/24/02 9:15 AM Terms and methodology The beat goes on. As Doc surmised after the close (see below), the late pop yesterday was the 1 day cycle high. And again, we see a gap down open in this illiquid environment. Timing is going to be tricky today because of the Fed meeting. Look for 1 day cycle low between 10 and 11. The high is due around 1. The market usually marks time in the two hours before the announcement at 2:15. What it does after that is anybody's guess. Doc will take one at the PM update. The 13 day cycle low is due today. That might not mean much in this environment, but if the cmaps are hit, at least a temporary bounce should materialize. In the bigger picture it would be inconsequential. Today may be the day when the 100 Nads goes through the Sphincters.
Doc does not make trading recommendations. This update reports intraday time cycle estimates and centered moving average projections based on the Hurst cycle analysis method. Doc assumes no responsibility for the accuracy or inaccuracy of these estimates and projections. The market may or may not meet these projections. New stoolies should thoroughly familiarize themselves with the methodology before trading based on this method. There is no free lunch. Those who do not have the time or inclination to develop a trading strategy based on testing and research should not trade. Trade at your own risk. Worst Shape Ever (9/23/02) Will there be a rally? Sure. Will it start today? Possibly. But it makes no difference in the scheme of things. This is one of the ugliest big pictures Doc has seen in 38 years of looking at this stuff. It is shaping up as one of the most prolonged, virtually uninterrupted drops in the market in history. The 13 day and 6-7 week cycle rally that's due now, either won't happen, or will be inconsequential. The best chance for a rally of more than 2-3 days is at least two weeks and maybe as much as five weeks away. That would be the widely expected October low. It will be the 4 year cycle bottom only if there's a monumental collapse over the next several weeks. Another 10-13 week cycle loop would still be needed to complete a six month cycle. A near crash and panic into October would set the stage for a successful retest in Q1 of 2003. But if the market simply dribs and drabs into an October low, then the next 10-13 week cycle be lower. Ugly. But profitable if you stay short, or get short on the bounces. The Feed put back the $1.75 billion it took out in a matched sale-purchase on Friday. And that was it, no other repos or permanent additions. There are no expirations on Tuesday. As Doc said Friday, the market will need a lot more help than the $1.75 billion if they want to get a decent rally going. The Total Feed is now back to the 8% growth channel (blue). The distance below the 10% growth channel continues to grow. Al has slowed Feed growth in the last 4 months. Maybe he's saving up for an enormous Feed blast when the Dow breaks the July-August lows. Whatever the reason, the stinginess does not portend a rate cut on Tuesday. Three trends are evident on
the Feed Index. One is the 10% growth trend beginning in May of 2001. Feed
growth has recently been at or below the lower boundary of that trend. The
blue channel going back to last December suggests that Al may now be
targeting an 8% growth rate. Then there's the golden box which says he's stopped growing Feed altogether over the last three months. The Feedometer has collapsed below its recent range. Why is the Feed tapping the brakes, and will it continue? Are they trying to keep inflation from creeping further into the CPI numbers? Could be. The last thing they need now is an inflation fear triggered selloff in the bond market. They are trying to avoid a catastrophic reversal in the bond market melt-up. Normally we'd expect a big Feed from this level on the Feedometer. We'll see. Unless they Feed, a continuing stock market plunge is inevitable. The
Feedometer theoretically
measures excess Feed available for bond or stock market jamming. How low will long term rates go?
Long term cmaps are starting to ratchet down again as the original targets
of 3.70-3.80 on the Ten Year Yield were hit. This often happens as markets
go vertical in the final stages of a move. The cmaps can now be construed
as pointing anywhere from 3.30 to 3.60. When this type of move ends, it
does not do so quietly. The snapback will be fast and violent. When it
turns, you'll know it. The little guys can cash out. It's the big guys
like Fat Ass (FNM), General Custer (GE), and General McClellan (GM) who
need to worry.
All of Doc's
cycle charts
are powered by METASTOCK Portfolio Sphincters Index (SPX) and Sentiment The SPX remained centered in in the lower half of its linear regression channel from the August high. Both the 17 day and 29 day rates of change are still downtrending, suggesting sustained downside. Doc continues to question the state of the 6-7 week cycle. When the 10-13 week cycle starts trending as it did last summer, the 6-7 week cycle becomes a non issue. The up phase of the 6-7 week cycle will generate a two day rally, then die. Whether a 6-7 week cycle low is in or not becomes irrelevant in that context. The superimposed 6-7 week cycle oscillator is rising from the lowest level it has reached in this bear market. The indicator will continue to correct upward barring anything less than a total collapse in price. Regardless of what price does, there is a subtle, almost unrecognizable positive change in momentum, which is, in fact, the cycle up phase, even though it can't be seen in the price action. Larger cycles are overwhelming whatever buying this cycle cohort is doing. As the up phase goes on, the market's vulnerability to sharp drop will only increase. Even if a bounce appears at some point, the trend is still down and a really big move down will follow. The 10-13 week cycle oscillator tends to mimic price action more closely. It continues to plunge. It should be 2 to 5 weeks before a cycle low. Any bounces would be within the context of this cycle's down phase. The VIX was nearly
steady at 44.71.
It is holding in the center of the inverted scale 6 month cycle Stool band.
This is not a configuration that suggests an important low. A reading in
excess of 60 is likely before
the next 10-13 week cycle low. Where it will settle at the ultimate
market low is anybody's guess. Assuming that certain levels are extreme is
unreliable, and this and any other sentiment indicator is useless
when used in that way. We can never know what "extreme" is
without actually charting the indicator just as we would a stock or index
price. The 17 day rate of change is a proxy for the 10-13 week cycle. the 29 day rate of change is a proxy for the 10-13 week cycle. The dark blue overlaid line is the 10-13 week cycle oscillator, while the red line is the 6-7 week cycle oscillator. The short cycle oscillator continues down, in position to drop for at least several days at the current rate, which is time for a lot more damage in a trend this week. This indicator tends to hit the "bottom line" at 4 or 6 week intervals, mimicking those cycles. By that measure the next good low might be nearly two weeks away. The 10-13 week cycle
oscillator is accelerating down, but is still well above the 50% line. Again,
room and time enough for a huge drop. The 6 month
cycle indicator still has not topped out, leaving us to wonder what kind
of disaster lies ahead when this indicator turns down. The same goes for
the 10-12 month cycle indicator. This is horrendously scary stuff, ladies
and germs. We may be witnessing only the early stages of the greatest
extended collapse in stock market history. Doc has a very preliminary
downside cmap of 660 for the 6 month cycle low due in January- February.
Short cycle cmaps are now 810-830. We should see some churning, around current
levels, for 3-5 days before starting down again.
Fiber Nacho Dump- Support levels and downside targets.
Fiber Nacho Reflux- Resistance levels and upside targets The Cycle Conditions tables include cycle phase and a wild guess as to number of periods to the next turn, in days for the shortest cycles, weeks (W) or months (M) for the longer ones. This is a fluid exercise, in other words, the projections are likely to be wrong, but they force us to be vigilant for key turning points, and frequently work well enough to prevent costly misreadings. SPX Cycle Conditions as of 9/23/02
PTT - Periods Till Turn Nasgap Charts The Nas set a new bear market low. So much for the test, successful or otherwise. It broke support like the proverbial hot knife through soft buttah, which brings to mind the 29th Precept of Stock Proctology- "Ain't no such thing as support in a bear market." Which is why we refer to them as "levels formerly known as support". You should not doubt that the Nasgap is, as always, leading this market. It was ahead on the way up, and is still ahead. The 17 and 29 day rates of change remain in downtrends. Even short term lows are usually preceded by a small double bottom or positive divergence in mo. We don't see that here. The 10-13 week cycle is in a down phase that should last 2-5 weeks, plenty of time for a lot more downside, even with an intervening bounce. The 6 month cycle indicator is topping out again, raising the question of how bad is this going to get when this indicator starts heading south. For starters, the very preliminary indication for the January-February 6 month cycle low is 1000. That will almost certainly drop a good deal more unless there's a big intervening rally. The 4 week cycle has turned down. The 6-7 week cycle is either at a low, or is just in the early stages of a new downleg. It matters not because the downward thrust of the 10-13 week cycle is the driver at this point. The chances of a meaningful rally in less than two weeks are pretty slim. But the short cycle oscillator is in the bottoming zone, so a minor pop or holding action is likely over the next couple of days. That would be consistent with a 13 day cycle low. The long
term cycle channel has two possible paths. Doc chooses the lower one. The
most bullish case would be for things to bump along within the dotted line
channel for months. But if Doc is right, and this is a six month cycle
top, the Nasty is headed for a three digit number. The 10-13 week cycle projection is
now 1020. Doc expects at least one more 10-13 week wave to lower lows to
complete the 4 year cycle.
Fiber Nacho Dump- Support levels and downside targets.
Fiber Nacho Reflux- Resistance levels and upside targets Nasdaq Cycle Conditions as of 9/23/02
PTT
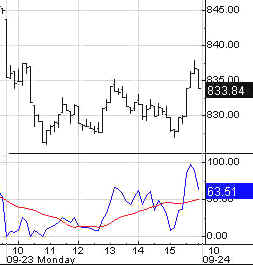
- Periods Till Turn AM Edition Features (Previous) These features are in morning edition, published around 9 AM ET US, or the Saturday Weak End Edition, published, uh, let's see, Saturday! Golden Stool Gold stocks
tend to alternate between a4 week and 6-7 week cycle . If the 4 week cycle
dominates the cycle low is due now at a cmap of 128. If the 6-7 week cycle
dominates the down phase could last another week or two with a cmap as low
as 122. The short cycle oscillator has reached the "bottom
line". A bounce could ensue at any time. Long Bong Hit - See top of page. Uncle Buck's Illness
Buck just keeps perking along in a flat 6 month cycle up phase. Based on
the cycle oscillator, the up phase is ending. Suctor Watch - Long Term Aerospace- When war breaks
out could be classic case of sell on the news. Bonkers- Trying to hold the
line. Wild volatility obscures true trend. Doc would ignore hints that the
group wants to bounce short term. Consumer- When the six
month cycle indicator turns down, this sector will be in panic mode. Retail- Completing top. Drugs- 6 Month cycle
topping out. More carnage ahead. Biodrech- Leading the way
to a bottom dropping. Health Care - Sick Housing Bubble- Sever gas
pains Energy- Bounce now, or
forever hold your peace. (sic) Trannies- Heads for runaway
truck lane. Small crap- Heading off the
charts. Where's the bounce? SOX- Picture worth 200
words. Anatomy of secular downtrend acceleration. Soft Where- Following SOX
lead. Nutworkers- Another tech
leader shows the way. Internuts- Trying to catch
up with nutworkers. Telecommies- Completing 6
month cycle top. Stoolwethers Citicorpse- Temporary
support operations are part of a top, not bottom. JPM- Should sit up in
grave, then back. Fat Ass- Temporary support
operations precede collapse. General Custer- Indians are
circling. General McClellan-
Preparing to cross Potomac. Horses can't swim. Market Maker Management-
Killing them softly. PiG- Better get more
lipstick, quick! Wally- Topping out too. AhOL- This is a top, not
bottom. AMZN- More sell signals.
But we've been faked out before. Crisco- Slides toward 10.
Slowly. Tell- May get there first! DELL- Farmer
says. BM- Do I hear 50? See you in Intraday Stool. Dr. Stepan N. Stool Share your thoughts on the Stool Pigeons Wire.
Renewals Welcome, and thank you for subscribing to the Anals of Stock Proctology. Your trial subscription will run for 90 days. At the end of that period your subscription will renew automatically, unless you cancel. If you wish to cancel your subscription use the button below. If you want to renew your subscription do nothing. Your subscription will renew and your credit card or Paypal bank account will be charged. If you want to renew, be sure your credit card information in your Paypal account is current. Paypal will not renew your subscription if the card has expired! Again, thanks for subscribing!
Explanation of Intraday Commentary-Build charts at http://www.livecharts.com. For custom time bars insert a comma after symbol and number of minutes, e.g. compx,90. This will give you a bar chart of the Nas with 90 minutes per bar. The one day cycle is usually most clear with 8 minute bars and 26/18 stochastics. It varies from day to day. Sometimes 6 minutes works best. Experiment to find the best fit for your trading style, and the market's dominant frequency at the time. The goal here is primarily to monitor the condition of the 8 and 13 day cycles. I typically use 90 minute bars with 26/18 stochastics for the 13 day cycle proxy on the indices during regular trading hours. Other cycles use 26/18 stochastics with the following: 8 days- 60 minute bars On the 24 hour futures charts, use a time per bar approximately 3 to 4 times the above number of minutes, to represent the cycles listed above. ABBREVIATIONS: cma: centered moving average
|
|||||||||||||||||||||||||||||||||||||||||||||||||||||||||||||||||||||||||||||||||||||||||||||||||||||||||||||||||||||

![[Most Recent HUI from www.kitco.com]](http://www.weblinks247.com/indexes/idx24_hui_en_2.gif)
![[Most Recent XAU from www.kitco.com]](http://www.weblinks247.com/indexes/idx24_sp500_en_2.gif)
![[Most Recent Quotes from www.kitco.com]](http://kitconet.com/charts/metals/gold/t24_au_en_usoz_2.gif)