|
Archives 12/30/01, 1/1/02, 1/2/02, 1/3/02, 1/4/02, 1/7/02, 1/8/02, 1/09/02, 1/10/02, 1/11/02, 1/14/02, 1/15/02, 1/16/02, 1/17/02, 1/18/02, 1/22/02, 1/23/02, 1/24/02, 1/25/02, 1/28/02, 1/29/02, 1/30/02, 1/31/02, 2/1/02, 2/4/02, 2/5/02, 2/06/02, 2/7/02, 2/9/02, 2/11/02, 2/12/02, 2/13/02, 2/14/02, 2/16/02, 2/19/02, 2/20/02, 2/21/02, 2/23/02, 2/25/02, 2/26/02, 2/27/02, 2/28/02, 3/1/02, 3/04/02, 3/05/02, 3/06/02, 3/7/02, 3/10/02,3/11/02, 3/12/02, 3/13/02, 3/14/02, 3/15/02, 3/18/02, 3/19/02, 3/20/02, 3/21/02, 3/22/02, 3/25/02, 3/26/02, 3/28/02, 3/30/02 4/1/02, 4/2/02, 4/3/02, 4/4/02, 4/6/02, 4/8/02, 4/9/02, 4/10/02, 4/11/02, 4/13/02, 4/15/02, 4/16/02, 4/17/02, 4/18/02, 4/20/02, 4/22/02, 4/23/02,4/24/02,4/25/02, 4/26/02, 4/27/02, 4/29/02, 4/30/02 5/01/02, 5/2/02, 5/4/02, 5/6/02, 5/07/02, 5/8/02, 5/09/02, 5/10/02, 5/13/02, 5/14/02, 5/15/02, 5/16/02, 5/17/02, 5/20/02, 5/21/02, 5/22/02, 5/23/02, 5/24/02, 5/28/02, 5/29/02, 5/30/02 6/01/02, 6/3/02, 6/4/02, 6/5/02, 6/6/02, 6/7/02, 6/10/02, 6/11/02, 6/12/02, 6/13/02, 6/14/02, 6/17/02, 6/18/02, 6/19/02, 6/20/02, 6/22/02, 6/24/02, 6/25/02, 6/26/02, 6/27/02, 6/30/02 7/1/02, 7/4/02, 7/5/02, 7/11/02, 7/14/02, 7/15/02, 7/16/02, 7/17/02, 7/18/02, 7/19/02, 7/22/02, 7/23/02, 7/24/02, 7/25/02, 7/27/02, 7/29/02, 7/30/02
|
The Anals of Stock ProctologyPublished weeknights by
8:30PM Happy Acres, Florida Time The American Academy of Stock Proctology and Is your subscription up for renewal? If you want to renew, do nothing, unless your credit card has expired. Please be sure your credit card info is current. If your credit card has expired, you must enter the new expiration date in your Paypal account in order for your subscription to be processed. If you subscribed via Paypal, your subscription will be renewed for one year on the 90 day anniversary of your sign-up and your credit card will be charged. If you want to cancel, use the button at the bottom of the page. This applies only if you subscribed through Paypal. Mailed-in subscriptions are for 1 year. If you subscribed by prior contribution, I will send you a notice before your subscription expires. If you have any questions, see the subscription page and FAQ's. If you can't find the answer, email me. PM Update 8/6/02 2:20 PM Terms and methodology The 1 day cycle should have peaked. If the down phase is sideways, bears have more pain ahead. The 5 day downtrend line which was broken this morning is now at Nas 1252 and descending. If it stays above that, not good for bears. If it falls below, it's a nice little Whopsaw, and bearish. There are no downside targets yet on the intraday cycles. Upside cmaps were met just before1 PM. The 5 day cycle cmaps appear to be around or only 10 points or so above the earlier highs. It's a little to early to be confident on those. The 8 day cycle projections could be substantially higher, with highs by Friday of Nas 1300-15, NDX- 955, and SPX 885, if the market holds its gains here. A lot hinges on what happens the remainder of today.
AM Update 8/6/02 10:20 AM Terms and methodology Revised 5 hour cycle cmaps - SPX 875, Nas 1262, NDX 910. AM Update 8/6/02 10:00 AM Terms and methodology Nice blastoff this morning. Same old same old. The chart boys saw the double bottom on the Nas and all sprang into action simultaneously. Now who's left to take the handoff? The 8 day cycle low is in, but the shape and duration of the up phase is yet to be determined. Spike or churn? That is the question. The 5 day cycle high is due today. 8 day cycle high due Friday. The 3 hour wavelet top is due 10-10:30 AM, with the low due about 12:30. That's juxtaposed against a 5 hour and 1 day cycle which should be moving higher. Assuming the market holds up through the morning, the bulls are in charge for now.
AM Update 9:25 AM 8/6/02 Doc is behind the 8 ball this morning. Upside cmaps for the 1 day cycle based on the futures are 846-50 on SPX, and 879 on NDX. That would correspond to 1225-30 on the Nas. 5 hour cycle high is due at 12 Noon, 1 day cycle high at 1:30 PM. 1974 Redux? (8/5/02) The charts tonight are as ugly as Doc's ever seen them. If the market rallies off this double bottom on the Nasty, it's going to be another great shorting opportunity. But it may not be so obliging. It could just gap down and collapse, based on how these charts look. The parallels with the summer of 1974 are spooky. That doesn't mean this market will play out in exactly the same way, but based the current configurations on the charts, I wouldn't bet against something that looks a lot like it. The
Feed added $6.5 billion today, plus an unspecified coupon pass which
settles tomorrow. Nothing is expiring tomorrow. It had looked
like the Feed had begun tightening Friday, as the 15 month constant 10%
growth channel was broken to the downside. Today's jam got the index back
into the channel, barely. However, the Treasury will be auctioning $62
billion of Bills, Notes, and Bonds over the next two days. Of that,
approximately $23 billion will be new money. Unless Al does one helluva
lot of preemptive Feeding again tomorrow and Wednesday, the net effect
will be a tightening. The Feedometer theoretically
measures the excess Feed available to the Gang of 22 to jam the markets.
The Feed was pumping through July, but lately they have
reversed course, bad news for the stock market. Without
jamming from the Gang, the market will be unable to sustain a rally. With
these enormous government auctions over the next few days, the Gang will
have its hands full. Without massive pumping from the Feed, this has the
potential to turn into a full blown disaster for stocks. Keep an eye
on those Feed releases tomorrow. It's also going to be interesting to see
how well the auctions are absorbed.
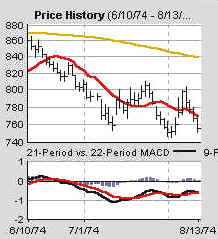
Portfolio Sphincters Index (SPX) and Sentiment
The cycle indicators suggest that the SPX is in a sideways up phase in the 10-13 week cycle. The 6 week cycle oscillator has begun to turn down. The VIX is headed back toward the level of extreme fear that has marked recent lows, but will not confirm an upturn in stock prices unless it successfully retests or breaks the recent extremes and then turns up. It rose to 49.3, but as you can see on the inverted scale Stool Band projection, that is no longer extreme. The 17 and 29 day rate of
change indicators which represent the 6-7 and 10-13 week cycles are
beginning to turn down at weak levels. Deterioration in the
indicators from here is extremely bearish as it would indicate
acceleration in the rate of decline. Centered
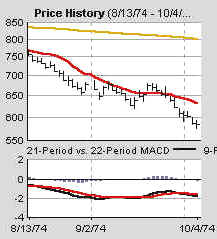
moving average projections now point to 750 as soon as Thursday or Friday. The 6 month cycle oscillator
still has not confirmed a bottom. The trading stoolicator, while moving up
slightly, is at such low levels that the upward movement represents merely
a slight slowing in the rate of decline, stemming from the late July
rally. The short cycle oscillator is topping out. The 10-13 week
cycle is in an up phase, but with longer term trends clearly still down,
it is getting flattened, and it raises the thought that a crash is still
possible from these levels. 830 is the target for the 8 day cycle. If that
breaks, the next target is the current 13 day cycle projection of 750. 829 and 800 are the next Fiber
Nacho dump levels, then the lows. The Cycle Conditions tables include cycle phase and a wild guess as to number of periods to the next turn, in days for the shortest cycles, weeks (W) or months (M) for the longer ones. This is a fluid exercise, in other words, the projections are likely to be wrong, but they force us to be vigilant for key turning points, and frequently work well enough to prevent costly misreadings. SPX Cycle Conditions as of 8/5/02
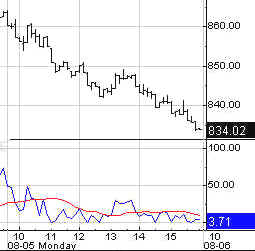
PTT - Periods Till Turn Nasgap Charts The Nas set a new closing low today. The 10-13 and 6-7 week cycles may have merged into a single 8-9 week wave. If so, the cycle low could have been in early July as indicated by the 10-13 week cycle oscillator. It's possible that this carnage could last into September, but let's take 1 day at a time.
The 10-13 week cycle oscillator says the Nas is in a swup. Maybe it will
bounce off this double bottom, or maybe it won't. The downturn in the
short cycle oscillator says that it won't, and the downturns in the rate
of change indicators tell us that, at best, the market is declining at a
constant rate. However, the timing of the downturns looks more like the
conclusion of a top, which would lead to an acceleration in the rate of
decline from here. Wouldn't that be shocking?
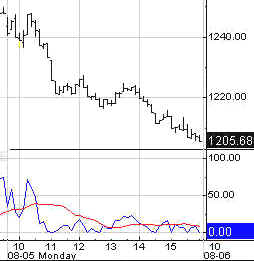
The air is rare below 1200. Nasdaq Cycle Conditions as of 8/5/02
PTT
- Periods Till Turn Golden Stool The 13 day
cycle cmap on HUI is 119. That was hit today. The 6 month cycle low
projection was 90-95. That's close enough ,although another test can't be
ruled out. The 10-13 week cycle ozzie is signaling that the low is in, but
with the other indicators as weak as they are, the next week or so should
see a retest. When the momentum based indicators at the top of the chart
turn up, we can get a little more bullish. AM Edition Features (Previous) These features are in morning edition, published around 9 AM ET US, or the Saturday Weak End Edition, published, uh, let's see, Saturday!
Uncle Buck's Illness
Economic Recovery Index Not looking
too good. Can't wait to see the July economic data from the gummit. Dee-fense
Dee-fense! Keep an eye on this test of the low. Could be a short term
dong... if it holds...for those so inclined. Not Doc of course. Biodrech- Is
the top in short term? Is the 10-12 month cycle low in? The 10-13 week
cycle is probably beginning to top out, but the 10-12 month cycle could go
into a swup for a couple months. Doc's guess is that it will establish a tradable
range. Bonk stocks
are bonkers. The 10-13 and 6-7 week cycles are in a swup, at best. Con-sumer
stocks, like banks, have seen an extraordinary increase in volatility. The
6-7 week cycle is topping out. The 10-13 is in a swup. Drugs and health
care have similar charts. Retail
should put in a 10-13 week cycle low, and start swupping. Watch for the
low to hold for confirmation. Homebubble
stocks could make a stand and consolidate here. Small craps should
hold the low for awhile as the 10-13 week cycle is in a swup. Energy is at
the bottom of the long term channel with intermediate cycles in position
to turn up. Short cycles are, on the other hand, toppy. Tech is
still dead. Mr. Bill
wants to swup too. JP wants to swup too, but will probably have more of a retest first. AMZN- a
classic Hunchback, sitting on the neckline. Wally wants
to go swuppin'. See you in Intraday Stool. Dr. Stepan N. Stool Share your thoughts on the Stool Pigeons Wire.
Renewals Welcome, and thank you for subscribing to the Anals of Stock Proctology. Your trial subscription will run for 90 days. At the end of that period your subscription will renew automatically, unless you cancel. If you wish to cancel your subscription use the button below. If you want to renew your subscription do nothing. Your subscription will renew and your credit card or Paypal bank account will be charged. If you want to renew, be sure your credit card information in your Paypal account is current. Paypal will not renew your subscription if the card has expired! Again, thanks for subscribing!
Explanation of Intraday Commentary-Build charts at http://www.livecharts.com. For custom time bars insert a comma after symbol and number of minutes, e.g. compx,90. This will give you a bar chart of the Nas with 90 minutes per bar. The one day cycle is usually most clear with 8 minute bars and 26/18 stochastics. It varies from day to day. Sometimes 6 minutes works best. Experiment to find the best fit for your trading style, and the market's dominant frequency at the time. The goal here is primarily to monitor the condition of the 8 and 13 day cycles. I typically use 90 minute bars with 26/18 stochastics for the 13 day cycle proxy on the indices during regular trading hours. Other cycles use 26/18 stochastics with the following: 8 days- 60 minute bars On the 24 hour futures charts, use a time per bar approximately 3 to 4 times the above number of minutes, to represent the cycles listed above. ABBREVIATIONS: cma: centered moving average |
||||||||||||||||||||||||||||||||||||||||||||||||||||||||||||||||||||||||||||||||||||||||||||||||||||||||||||||||||||||


![[Most Recent HUI from www.kitco.com]](http://www.weblinks247.com/indexes/idx24_hui_en_2.gif)
![[Most Recent XAU from www.kitco.com]](http://www.weblinks247.com/indexes/idx24_sp500_en_2.gif)
![[Most Recent Quotes from www.kitco.com]](http://kitconet.com/charts/metals/gold/t24_au_en_usoz_2.gif)