|
10 Minute Bar Charts 5/13/02 Dow Jokes Inflatables
Archives 12/30/01, 1/1/02, 1/2/02, 1/3/02, 1/4/02, 1/7/02, 1/8/02, 1/09/02, 1/10/02, 1/11/02, 1/14/02, 1/15/02, 1/16/02, 1/17/02, 1/18/02, 1/22/02, 1/23/02, 1/24/02, 1/25/02, 1/28/02, 1/29/02, 1/30/02, 1/31/02, 2/1/02, 2/4/02, 2/5/02, 2/06/02, 2/7/02, 2/9/02, 2/11/02, 2/12/02, 2/13/02, 2/14/02, 2/16/02, 2/19/02, 2/20/02, 2/21/02, 2/23/02, 2/25/02, 2/26/02, 2/27/02, 2/28/02, 3/1/02, 3/04/02, 3/05/02, 3/06/02, 3/7/02, 3/10/02,3/11/02, 3/12/02, 3/13/02, 3/14/02, 3/15/02, 3/18/02, 3/19/02, 3/20/02, 3/21/02, 3/22/02, 3/25/02, 3/26/02, 3/28/02, 3/30/02 4/1/02, 4/2/02, 4/3/02, 4/4/02, 4/6/02, 4/8/02, 4/9/02, 4/10/02, 4/11/02, 4/13/02, 4/15/02, 4/16/02, 4/17/02, 4/18/02, 4/20/02, 4/22/02, 4/23/02,4/24/02,4/25/02, 4/26/02, 4/27/02, 4/29/02, 4/30/02 5/01/02, 5/2/02, 5/4/02, 5/6/02, 5/07/02, 5/8/02, 5/09/02, 5/10/02
|
The Anals of Stock ProctologyPublished 5 times
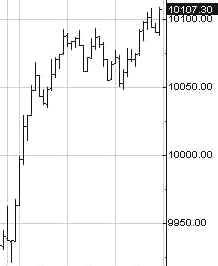
per week by the American Academy of Stock Proctology and Out With The Bad, In With the Good (5/13/02) The powers that be at Sphincters Index Inc. (aka S&P) announced today that they are dropping Worldcommie and US Scareways from the Sphincters Index. This brings Doc to one of his favorite topics, The Big Freakin Wall Street Lie. You know the one, about how stocks return yadda yadda percent over the long haul. The reason the percentage is yadda yadda instead of ZERO after inflatulation, or even negative yadda yadda over long periods, is that every month or two they take out the bad and put in the good. Now ask yourself, is that a true picture of reality? Shouldn't an index keep the crappy stocks along with the good ones? When they go to a buck, or zero, shouldn't they stay in the index, having the same impact as they do in a typical portfolio? Let's call it the lead weight impact.Where would the Sphincters Index be today if all the lead weights they took out, that went to zero over the last ten years, had stayed in? Of course, we'll never know. Because no one on Wall Street keeps stats like that. And even if they did, they wouldn't tell us! Keep in mind that the nominal compound return on the Sphincters Index since 1926 when it started is about 5% before dividends, commissions, management costs (and dare I whisper taxes). Over the last 100 years the Dow's compound annual rate of return is also around 5%. After inflation, that's pretty damn close to zero. So if your portfolio manager was just a little below the mean, your real return was negative. And how many of the original Dow stocks are still in the Dow? One. The Feed added $2 billion in overnight repos today, on top of Friday's $2.1 billion in 6 day repos. The also did a coupon pass of $1.5 billion. That's about $4.3 billion in net new money since Thursday. Pretty aggressive. Definitely a bit of a change from their stinginess in weeks prior. Last week Doc noted that the Fed added $13.8 billion in T-bills maturing on May 9 that he could not account for. It turns out this was the result of a matched-sale purchase the prior week. This was hidden away in a footnote in the Fed's weekly System Open Market Account statement. The previous week the Fed had sucked this money out of the system by the sale, but had made a deal to put it back the following week. And exactly when did that $13.8 billion go back into the system? Why, May 8, of course. And let me see, did anything special happen on May 9? Only a triple digit gain in the Nasgap and 300+ points in the Dow, that's all. But it was just a coincidence, of course. Just so you understand the mechanics, the Fed buys and sells securities through its primary dealer network, a group of 22 small firms no one's ever heard of, like Golden Sacks, Mohel Lynch (Oy do we got tips for you!), SlimeySmithBorkedMe, Moogan Stoogley, JP Moogan, et. al. So, the week before the Fed sold these bills to the Gang of 22, whoosh, suck, suck. Out of the banking system came the $13.8 billion. When it came out, all the markets shuddered. (Coincidentally, of course.) That was May 1. But, aha! It was only a trick, because Al and the Gang of 22 had made a deal to give them back the money on May 8. Boom, all at once, $13.8 billion in the hands of Golden Sacks, Mohel et. al. to do with as they please. Which they leverage by something like 8 to 1. And we do know what they did with that money, don't we? Yes we do. It gets a little complicated because those bills expired the next day. The US Treasury then has to write a check to the Fed for $13.8 billion. Now the Fed has the wherewithal to buy more securities. (which they have any way by running those presses down in the basement at 33 Liberty Street.) And we know the gummit will be selling more and more because of ballooning deficits. The Fed will either buy that debt, and thereby monetize it, stoking inflation fears and sending bond yields through the roof. Or they won't buy it, and short term rates will skyrocket. It gets even more complicated because sometime during the week ending May 1, the Fed did another matched sale-purchase for bills maturing May 16, for $8 billion the week before, and $14 billion last week. While the Fed makes it fairly easy to find some of what it's doing through its daily announcements of repurchases and coupon passes, these matched sale-purchase deals do not get reported every day, and are buried in the footnotes of the weekly System Open Market Account statement. These moves tend to be much larger than the daily repos and coupon passes that the Fed makes public daily. Do they have something to do with the rocking motion in the markets week to week? Uhhh.... The footnotes revealed that the Fed did total matched sale-purchases of $21 billion the week ended May 1, then $18.6 billion the week ended May 9. They bought back $13.8 billion of the first week's deal last week. $8.1 billion comes back this week, and $4.6 billion next week. We'll be in the dark about any sales done this week until Thursday's weekly releases. If there are none, then the $4.6 billion will be a net addition. On balance, given the coupon pass and repos added today, the Fed appears to be feeding a little more aggressively this week than over the past few weeks. The stock market is stabilizing as a result, but the bond market is beginning to act poorly again, in response to the inflationary fears that excess money creation and ballooning government deficits cause. Under the circumstances, the trendless uncertainty and day to day volatility in all markets is likely to continue until the bond market forces the Fed's hand. That could be a week, or it could be six weeks, but the day of reckoning is coming. Dow Inflatables
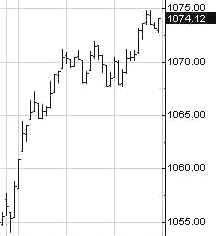
Portfolio Sphincters Index (SPX) and Sentiment The SPX reversed Friday's loss and then some. The 17 day rate of change, a proxy for the 6-7 week cycle, is moving in a narrow, flat band, in negative territory, in what should be an up phase. This has extremely bearish implications if the line does not emerge to the plus side. The 6-7 week cycle oscillator superimposed on the chart also remains in a negative pattern. It is still telling us to be suspicious of any rallies. This looks like distribution. The 29 day rate of change, representing the 10-13 week cycle, still hasn't flashed a buy signal. It's very close, but as President Clinton taught is, close is not a cigar. The 10-13 week cycle low is due, and we've been looking for it, but why is there no confirmation from the indicators? The bottoming phase is probably under way, but it could last another week, during which time the market will remain vulnerable to a vertical spike. After that, the best the bulls can expect is wild, but sideways for awhile. The VIX fell to 23.51 from Friday. On the inverted scale chart, VIX is in the center of the Stool Band, nowhere near the levels of fear necessary to signal a significant bottom. A reading of less than 22.5 would signify the beginning of a top in this cycle. At the end of April the index reached a level indicating an imminent upturn in the 10-13 week cycle. The market appears to be beginning a sideways up phase in the 10-13 week cycle. The Stool Band is now beginning to bend down. A sizable intermediate rally probably won't come until the index is below the lower band, or now a reading above 32, and perhaps more. The blue channel lines are the extension of a linear regression channel from the February and May 2001 highs.
The 5-6 month and 10-13 week cycle oscillators in the cycle chart below have turned flattish, but this is still not the same as turning up. The trend is confirmed until the direction of the lines actually reverses. The short cycle oscillator is just as befuddled as the market. It's just reflecting what is. But it's telling us that the market is in one of those quintessential sideways up phases that stoolies have grown to love, because of what usually comes after. The Trading Stoolicator stayed in a trough. It bears repeating that this is not a reversal signal until both lines turn up. The fact that the lines are still below neutral means that the sum of downside forces still have the upper hand for now. The rally negated downside projections for the shortest cycles. The 10-13 week cycle still has a projected low of 1040. Eh?? Shorter cycles have an upside of 1090. Many of you are thinking the market might crash from here. The centered moving average projections are not forecasting it. A crash is never an event that can be considered probable, but historically, those rare occasions when crashes have occurred, have occurred from similar conditions. Crashes take place when a cycle trough appears to be in place but key support does not hold. Under those conditions a major downside "event" can occur. For short side traders this condition is very seductive, and very dangerous. If you bet on it, and bet wrong, you can get your clock cleaned and lose all of your trading stake. (From one who's been there.) Of course, if you're right, you won't ever need to do another trade. Either way, it could be your
last trade. The choice is yours. As always, if you decide to take
the risk, listen to your Uncle Stool. Use protection. Fibo resistance is at 1079 and 1097.
The Cycle Conditions tables include cycle phase and a wild guess as to number of periods to the next turn, in days for the shortest cycles, weeks (W) or months (M) for the longer ones. This is a fluid exercise, in other words, the projections are likely to be wrong, but they force us to be vigilant for key turning points, and frequently work well enough to prevent costly misreadings. SPX Cycle Conditions as of 5/13/02
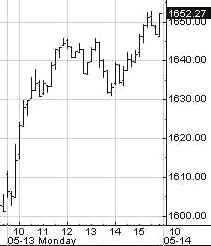
PTT - Periods Till Turn Nasgap Charts The Nas also reversed Friday's loss. Seems there are still enough nervous shorts around for the stage managers to do their thing at will. Today it was, for the umpteenth time, the borking of AMAT. It was SG Cowen's turn to do the honors. The 5-6 month cycle oscillator is still stuck in neutral in what Doc believes is the final days of a big cycle top phase. If it's not, then it will break out above the zero line in the days ahead. Then we can really start to worry. The 10-13 week cycle
oscillator's overall pattern is still down. Doc's composite trading stoolicator
is beginning to form a trough. Both lines need to head up to confirm the
rally. Wave band
resistance is now in the 1675 area. If that's broken, the 10-13 week cycle
up phase is likely to see the index head into the 1700s. Fibo resistance is at 1652, right where the index closed, 1667, and 1698-1710.
Nasdaq Cycle Conditions as of 5/13/02
PTT
- Periods Till Turn The 10-13
week cycle in bond yields has turned up. Bond yields are exploding higher
on the retail sales news this morning. The test of strength will be
whether yields power through the 5.40 area. They are at 5.30 this morning.
If the intermediate cycle oscillator at the bottom of the chart can turn
up, then we can expect to see a breakout above 5.50 and confirmation that
the secular trend has turned from a flat bottom phase, to up. The dirty
dirty SOX are at the 10-13 week cycle low. Question is whether the 5-6
month cycle is also bottoming. And the BIG question is what shape will the
up phase take. The "up" phase is up relative to the direction of
longer cycle phases. It means that prices should move from the lower edge
band of the next longer wave to the upper band. In this case the
narrow dark green band might turn up toward the light green upper edge
band or it might turn due east while the broader cycle turns down to meet
it. The thrust of the initial push off the lows will give us a
clue. The energy
index looks like it could really roll higher in the weeks ahead. There's a
lot of upside here if the index breaks out above 560, as it looks ready to
do. CSCO has turned its 10-13 week cycle higher. The key test of strength will be what happens whether and when it gets to the upper edge band projection of the intermediate channel at 17. If all the cycle oscillators are still positive at that point, CSCO would headed back to 20.
MSFT appears to have put in a 10-13 week cycle low. Expect the up phase to take the form of a trading range between 50 and 57.
WMT also has
an upturn in the 10-13 week cycle oscillator from a key support area. It
is moving smartly higher in the pre-market on the retail sales news. WMT
could be headed back to 60. A month ago,
Doc featured one of his own Stock O' picks, EMC, at 11. This illustrates
the principle of shorting weak stocks at resistance. 11 bucks was trend
resistance at the time, enabling a short sale entry with a close
buy-stop. As it turned out, the stop would not have been necessary, and
there are still no buy signals. (Past performance is no guarantee... yadda
yadda.) Stoolie Mike requested Gold Fields. Unfortunately Doc's data vendor has a problem with symbol changes. As soon as we get that straightened out, we'll have a look. Meantime, Golden Stool tells the tale of the gold stocks. If you have an idea for a Stock O', send it to [email protected]. Include some original reason for why you think the stock is deserving. Be clever! Anything longer than 25 words- automatic disqualification! And please, no penny stocks. Feel free to request follow-ups too. Uncle Buck's Illness Think of
Uncle Buck as a dog. His master's voice is the US stock market. The
intermediate cycle is trying to find a bottom, just like the stocks. If
the red oscillator turns higher look for the index to move across the red
channel toward the upper channel boundary. That could take the shape of a
flat trading range or a mild rally. If the oscillator does not turn up
now, the slide will continue. Golden Stool The gold
stocks just keep barreling higher. The sector is trending. Cycle
indicators are going to give false signals from time to time under the
circumstances. The trend is your friend. See you in Intraday Stool. Dr. Stepan N. Stool Let me know what you think on the Stool Pigeons Wire. Previous complete issue with all features Welcome To New Subscribers Welcome, and thank you for subscribing to the Anals of Stock Proctology. You may note some subtle differences in style now that this is no longer a free service. The perspective is still bearish, but it will have a more balanced approach than my message board ravings. You won't see me screaming "BUY" about anything except perhaps gold, but you will see stronger indications of areas and times when I think it might be a good idea to avoid being short. And I promise that I will lose my temper from time to time to keep you entertained! There's also a new feature, Doc's By Request Stock O' The Day. If you have a stock you're interested in, send an email to [email protected], naming the stock, and why you think Doc should look at it, in 25 words or less. 26 words, and you're disqualified! Those that look interesting, Doc will try to feature here within the next day or two. If you have suggestions about other features you'd like to see, send them along to [email protected]. Again, thanks for subscribing!
Explanation of Intraday Commentary-Build charts at http://www.livecharts.com. For custom time bars insert a comma after symbol and number of minutes, e.g. compx,90. This will give you a bar chart of the Nas with 90 minutes per bar. The one day cycle is usually most clear with 8 minute bars and 26/18 stochastics. It varies from day to day. Sometimes 6 minutes works best. Experiment to find the best fit for your trading style, and the market's dominant frequency at the time. The goal here is primarily to monitor the condition of the 8 and 13 day cycles. I typically use 90 minute bars with 26/18 stochastics for the 13 day cycle proxy on the indices during regular trading hours. Other cycles use 26/18 stochastics with the following: 8 days- 60 minute bars On the 24 hour futures charts, use a time per bar approximately 3 to 4 times the above number of minutes, to represent the cycles listed above. ABBREVIATIONS: cma: centered moving average |
![[Most Recent XAU from www.kitco.com]](http://www.weblinks247.com/indexes/idx24_nasdaq_en_2.gif)
![[Most Recent XAU from www.kitco.com]](http://www.weblinks247.com/indexes/idx24_sp500_en_2.gif)
![[Most Recent Quotes from www.kitco.com]](http://kitconet.com/charts/metals/gold/t24_au_en_usoz_2.gif)
 Chart Powered by METASTOCK