I'm heading up into the mountains a bit with this chart...the air is a little thin up here, but I think maybe one or two lurkers/posters can get it.
If you truly want to learn...
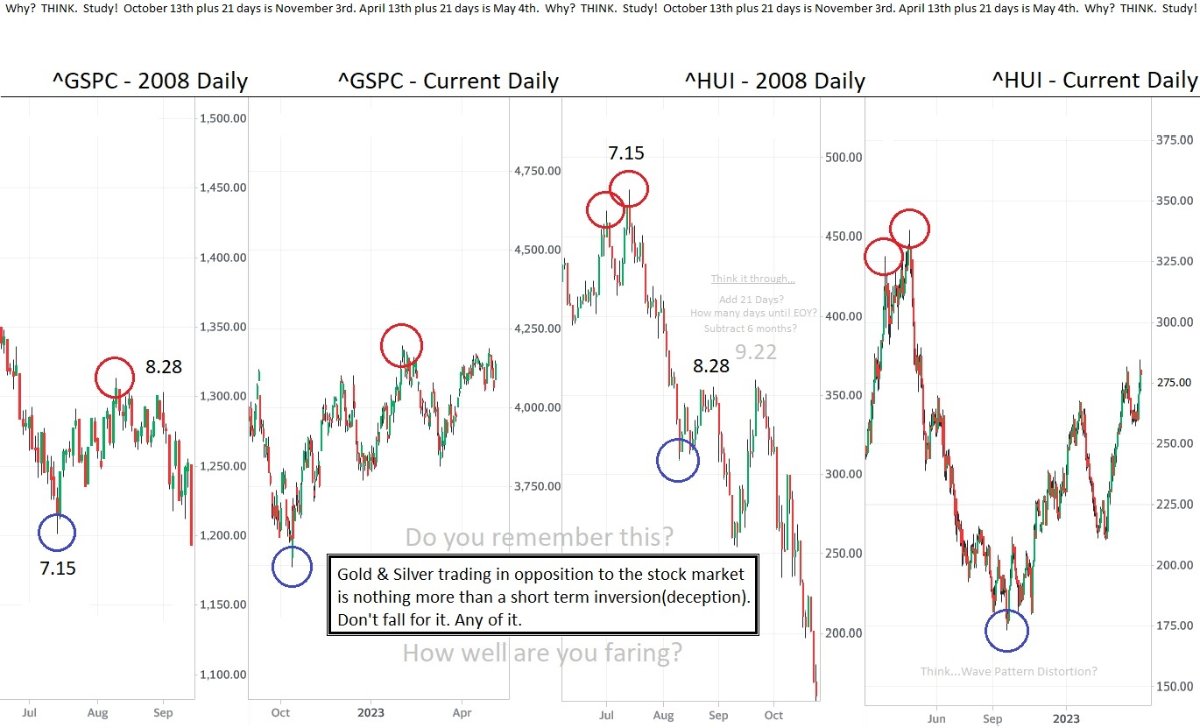
Study the first chart in the Dumb, Dumber, and Dumbest series...and then take a good look at this.
Take the time to give it some serious thought...
What IS going on here? Why? How?
If you can grasp this, or if you at least try...I'll fill in the blanks going forward.
Here a little, there a little...until it ALL comes into view.
TCG
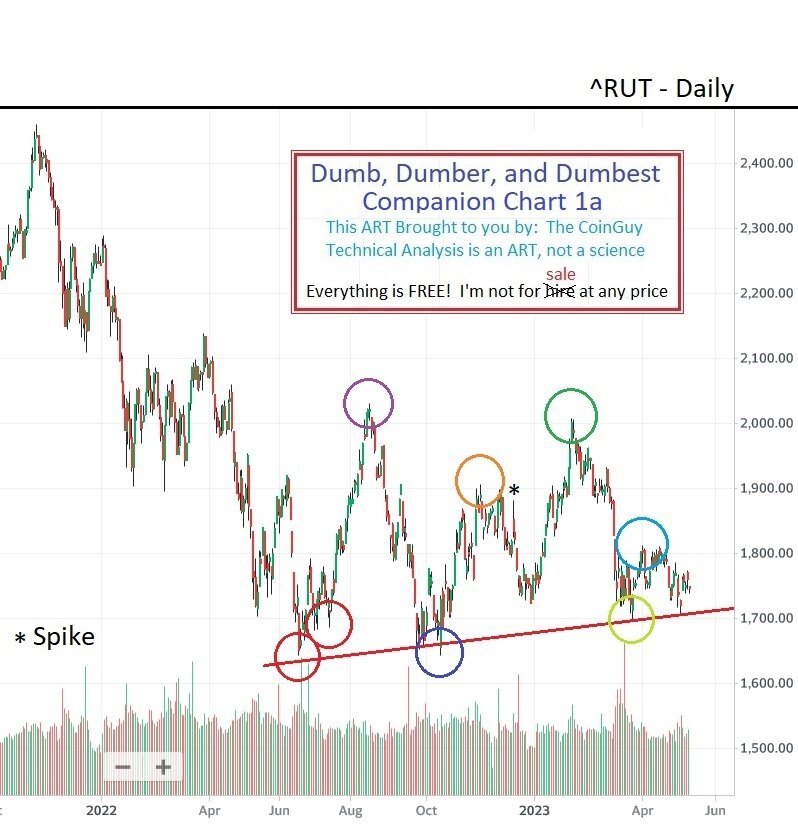
My "Dumb, Dumber, and Dumbest" Chart was posted early this morning, so it will be in yesterday's thread. Here is the first Companion Chart in the series.
The Russell 2000 is barely holding support...while the Nasdaq is attempting a push through resistance.
Interesting.
TCG
oh...and...
Patience Pays
Maybe if I post a variation of this pattern you can understand why even TCG would never front run the above setup. I always wait for a break on volume(and confirmation).
While the pattern eventually works in your favor...if you front run...you get treated to a nice punch in the face first. Having spent time in the ring...I prefer the patient approach to a busted nose.
If you've read my 'Pro Tip' commentary...I think it all boils down to this.
TCG
oh...and...
I wanted to give a quick update to my "ETH to a 1000 in 90 days" challenge. The challenge started on April 10th(4.10) and I have 68 days left to cover 'around' 750 bucks. Will it make it? I could care less...the only reason I bothered to start the challenge was to point out the sheer stupidity of making a call that Bitcoin would be trading at a million dollars a share within 90 days.
As far as I could tell...some big hitters within the space weren't exactly poo pooing the idea either. Now...I'm a gentlemen so I won't go any further in my commentary toward those individuals other than to say....No TCG nod of approval for you.
Out of curiosity...I did take a look at the chart this morning. It might just make it...smile.
Why I'm here...
Sniff...Sniff. There’s something in the air.
As we start our 3rd week in the Serengeti. Tom...our cameraman has just discovered a young male lion prowling through the brush on the west slope. Perhaps, we should pause for a moment and take in the beauty of this magnificent beast...
Oh, wait.
As I panned left with my binoculars I just caught a glimpse of a young gazelle limping into in the middle of the field…
I’ve swam by this issue three or four times now...I like to wait until they stop kicking before I take a chunk.
Like I said, “They have one push left”...and...you’re in the latter stage of that push right now. when the NDX gives it up...well, you know.
Truth is. PYPL isn’t the canary. I am….and...I’ve been tweeting loud and clear for weeks.
Three heads….of the same entity? Huh? What?
I think anyone that knows me knows my favorite pastime. Stock Market Crashes.
I've had time to go through all of the current bank charts as well as the current charts of the individual stocks in the ^DJI. I took all of these issues and have compared their patterning behavior against the 'textbook' crash and bankruptcy patterns from my historical database(archive).
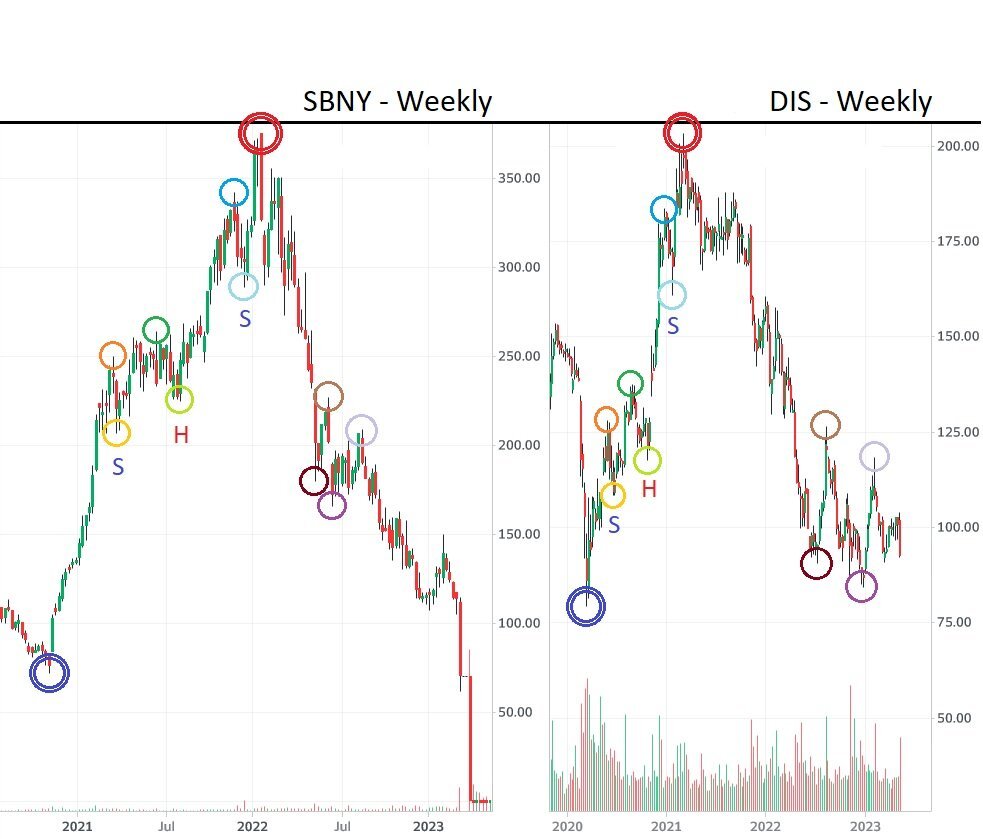
I gave you a sample in Disney...but my God man. I say this with no jesting.
I'm concerned.
The CoinGuy
What numbered day of the year is 4.10?
As I head back out the door...I'm going to leave a couple charts.
Google on the Daily...
Google on the Weekly...
Best of luck everyone,
TCG
oh...and...
For convenience...
And perhaps I should leave you with this thought. I never had the time to finish this chart...and after this weekend(and beyond)...well. Time is up...
If you really want to understand the current situation we find ourselves in...all you have to do is go back and study what I repeatedly said to study....over and over again. That is the lead up to the Jan 2022 peak...
Here's a couple of my scratch sheets to get you started...
The CoinGuy's secret sauce is to learn to measure from the center to the outside. This...will get you started...and then some.
Doc: For those who don't have social media accounts...Please consider continuing to post a few pictures on-site.
And...have a great time.
I actually admire the French. While Americans sit on their couches....the French go into the street.
SiP: Excellent photography.
JIMBO: I don't comment on your posts as much as I should, but I do enjoy reading them. All of them.
I do believe Warren is holding cash(or cash equivalents) for the same reason I am.
In fact...I can remember only two people in the whole world who were very vocal about mentioning this at the beginning of 2022.
Both are members of this forum.
TCG
oh...and...
My fellow goldbugs...
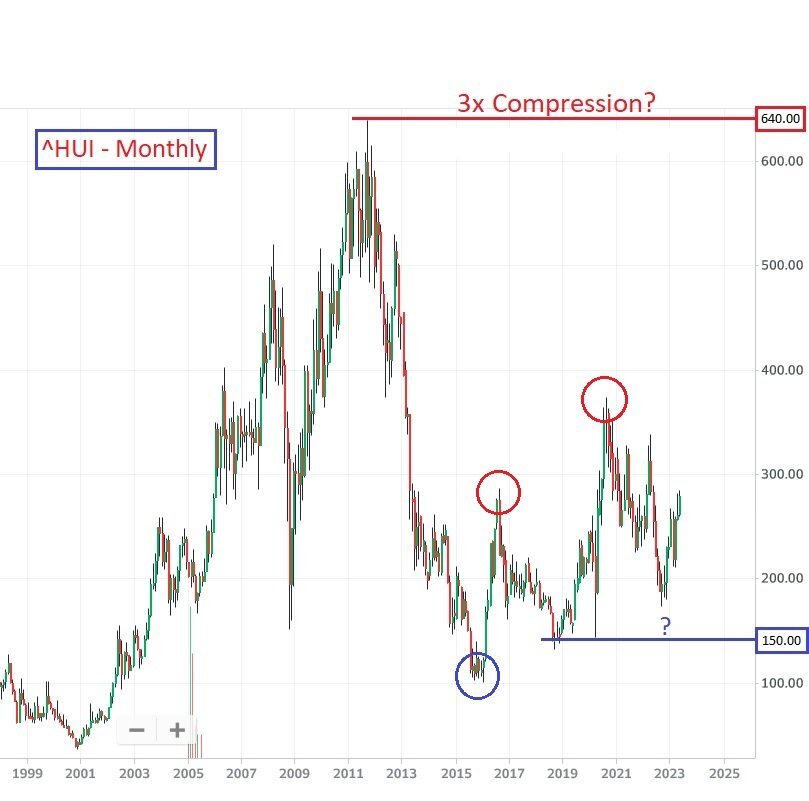
Remember what I said. This market simply cannot pause here. It has to continue going upward and to the right. ANY strength back below 275(especially if it tanks below 272 on Volume) - protect yourself. Nesting cups at peaks/valleys usually ends in tears. This is NOT the time to be playing games.
Below 260? It's over.
For those in the ^GSPC. Don't lose sight of the 'left peak' high on February 2nd. A move above 4195.44 might temporarily slow down any market bearishness...
If it fails to overcome the swing? After all the charts I've posted...I don't think there is any further need to elaborate.
There are rumors everywhere...but only The Shadow(Banks) Know(s).
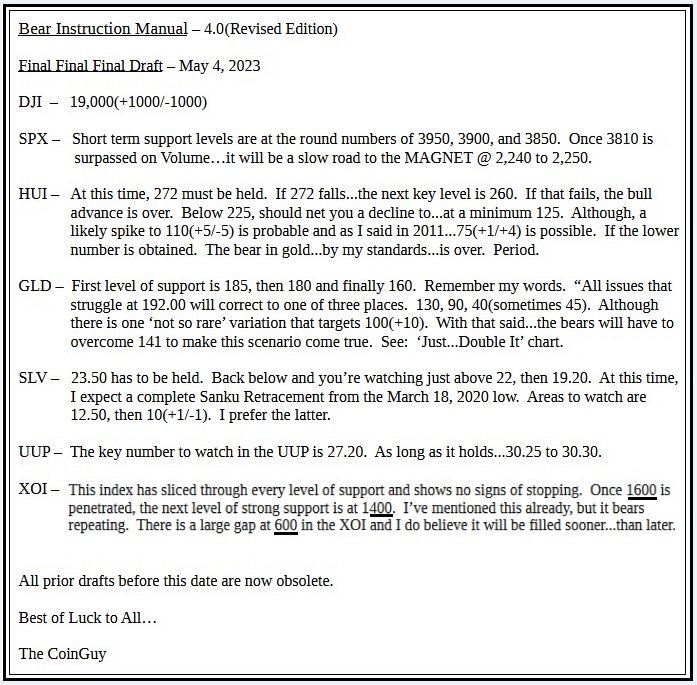
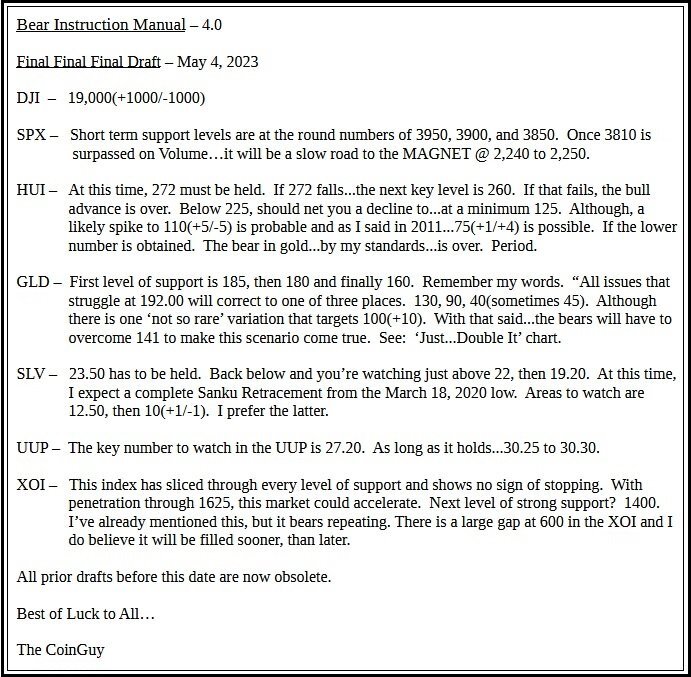
Quick Revision to BIM - 4.0
While looking back to my post from last evening...I agree with every word(especially in regards to the metals), but I believe there wasn't enough emphasis within the BIM itself in regards to the major trend line at 1600 in the XOI.
Therefore, I made a quick revision to the BIM to make this point more clear.
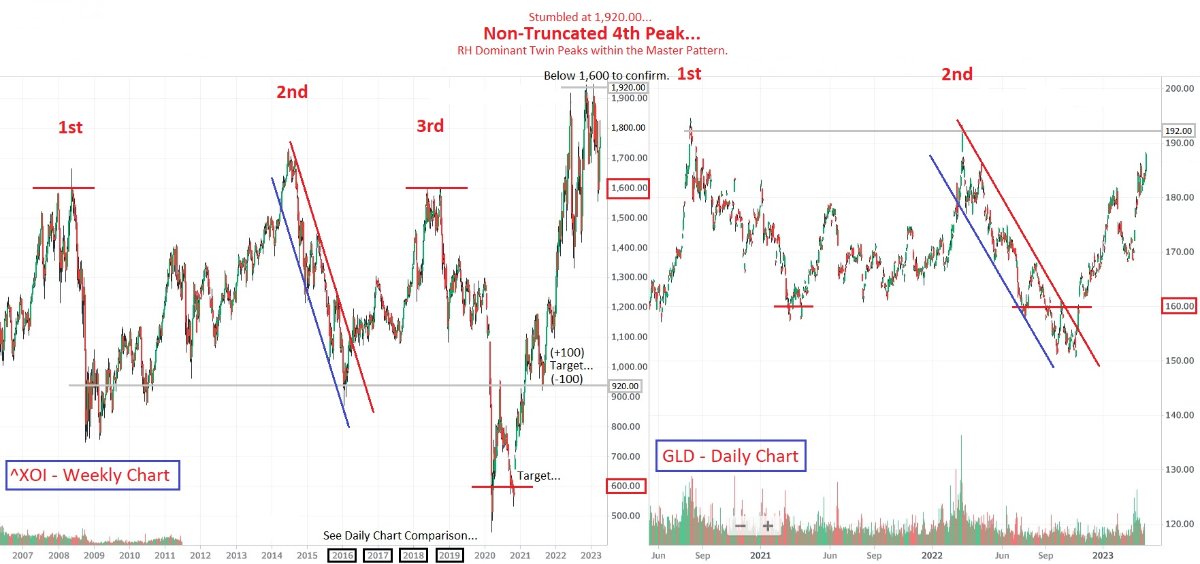
Since I'm here and I'm speaking about the XOI...I'll re-post this old chart. Quite dated...but the thought on the numbering structure going forward - is sound.
I'll also re-post this chart. Between these two charts...I think the picture becomes quite clear.
- AND -
Never forget...issues that stumble at 1920 go to where?
As we head into a new day across the pond...I'll close with this.
The Coronation of a King...
If I recall correctly...it was the Kings(and Merchants) who wept when Babylon fell.
At one time...I believe I also heard. All power(and authority) has been given...to topple Kingdoms.
You know...I’ve always wondered. What would happen if the whole world woke up one day and discovered the stock market was a complete scam from the very beginning?
Well, that’s just crazy talk...right?
Again, I wish you all the best.
The CoinGuy
oh...and...
(sometimes 4.50)?
The Banners are already waving over the horizon. Won't be long now. Soon. Very...Soon.
As I exit stage left I'm going to drop this...
I added key short term support levels in the SPX and the metals. I sense a change in the latter, be on your toes. Also had to revise the XOI for the 3rd time! I looked over that chart good...if you slice through 1600, then I do believe 1400 will hold for a time.
Best of luck to everyone...I'll see you sometime down the road.
The CoinGuy
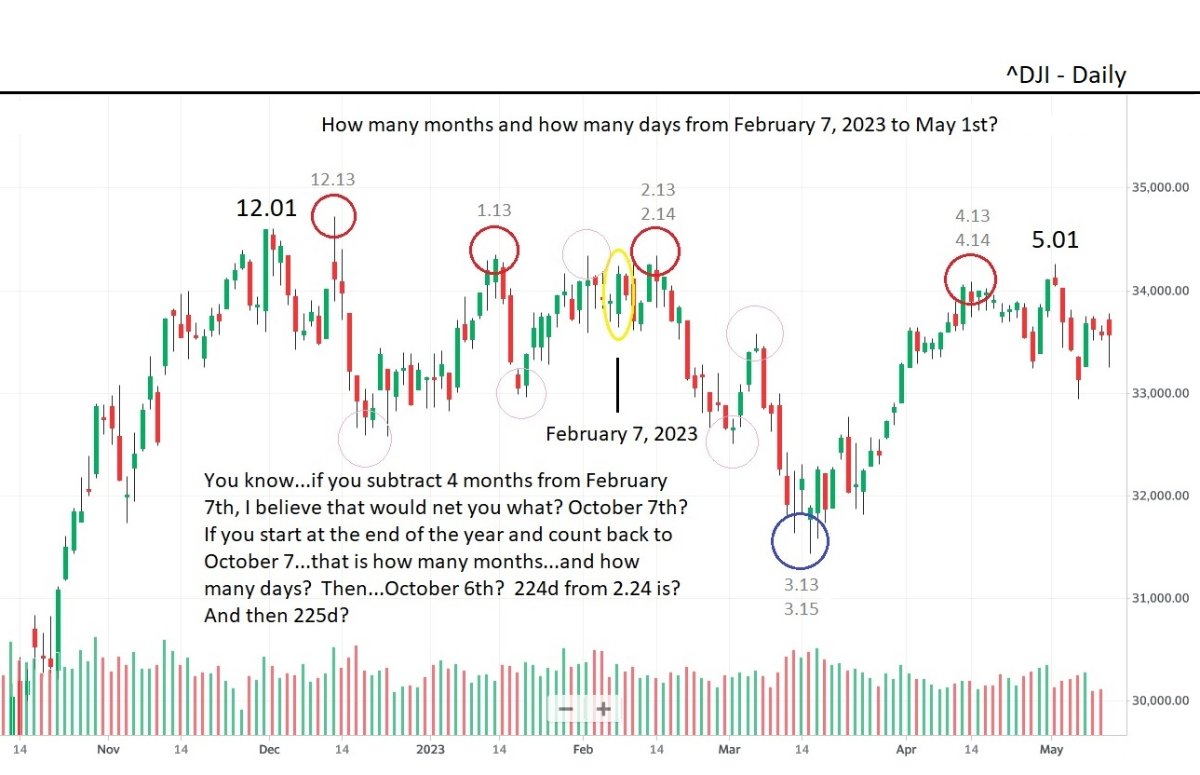
From October 13th to May 1st is how many days?
I looked through the archives here on Capitalstool and my archives on our server. I posted here up until the 21st of April. Most of the charts I've produced since have been for private consumption...but I have a few I can toss out there. You might get something out of them...you might not.
I have a file folder on the server called "ROUGH"...it's where I keep my rough drafts of what I plan on expanding on in the future. I saw something in there that caught my eye. It has to do with the ^HUI...I'll come back at a later time when I've developed the chart and have a comment or two.
Ok...Onto a chart or three...maybe even half a dozen.
I'm just going to start commenting and I'm going to keep commenting 'off the cuff' until I get tired. When I'm tired? I'll see you somewhere down the road.
I believe I've already mentioned I have several former students who like to hang around the 'nest'.
The conversation as of late has been centered around the banks. Bank of America(BAC) has been coming up more than most for some reason. Probably because of the weakness being displayed in the chart. I think they're seeing vulnerability here...
Out of the larger banks...it's toward the leading edge in this current decline. Especially when I start to consider the 'shadow banking' system. You know...the guys in the background? Although, most have not crossed the line of no return - yet.
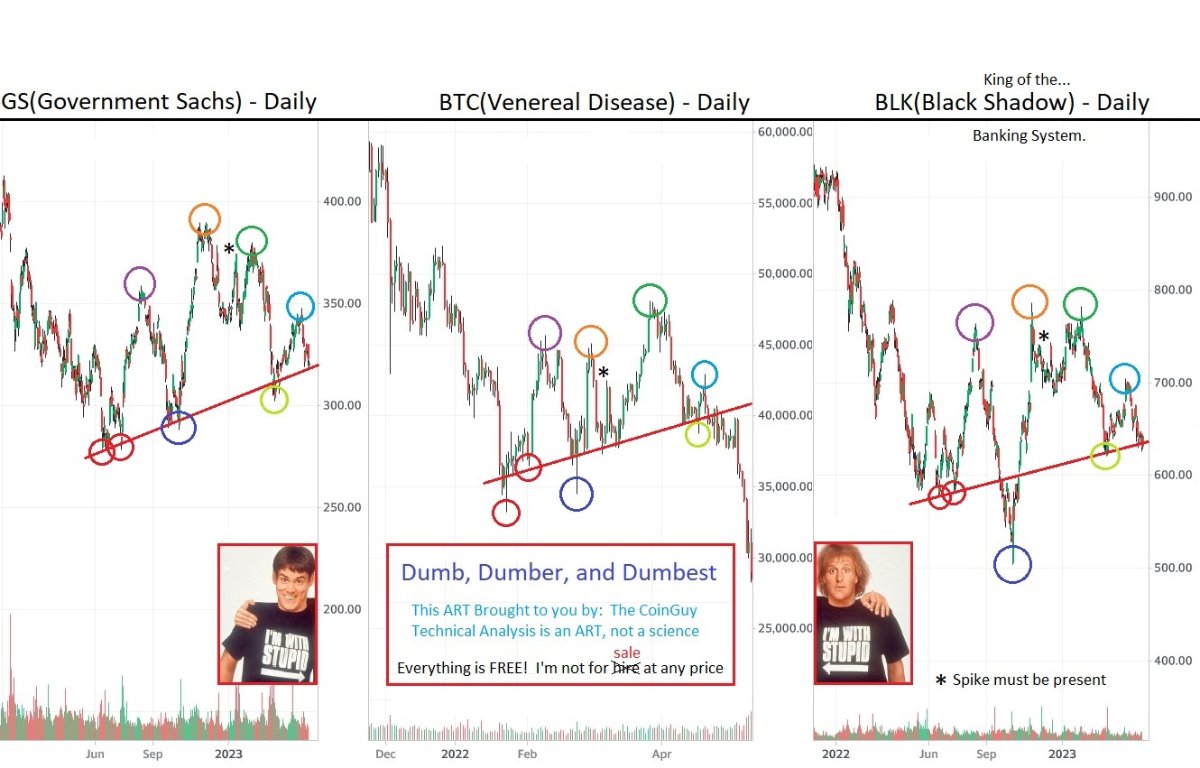
I repeatedly made sure you were aware of this line back when BTC and ETH were sitting just above the edge. Now...I'm showing you BLK straddling the same line.
With that said...here is a chart of BTC in a comparison chart against BLK. Before viewing this chart though...please recall my recent introduction to...Wave Pattern Distortion. This. Is a perfect example.
The chart is a couple of weeks old now...and...we're currently drawing near to the line. Once broken...under 400 is where she ought to come in for a nice landing. Oh...and BAC? Anything south of 17.50 means serious trouble.
Since we've mentioned BTC, I'll toss out this chart of the Russell 2000. Better be watching that line carefully...
I had someone ask me about tech. I believe during the beginning phases of the tech wreck, the ARK Innovation ETF was mentioned daily as some form of poster child for the excess coming out of the 2020 lows.
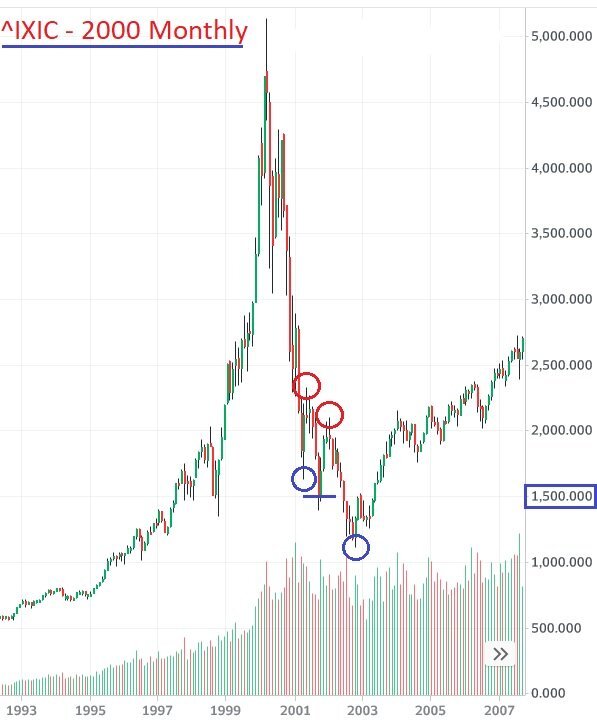
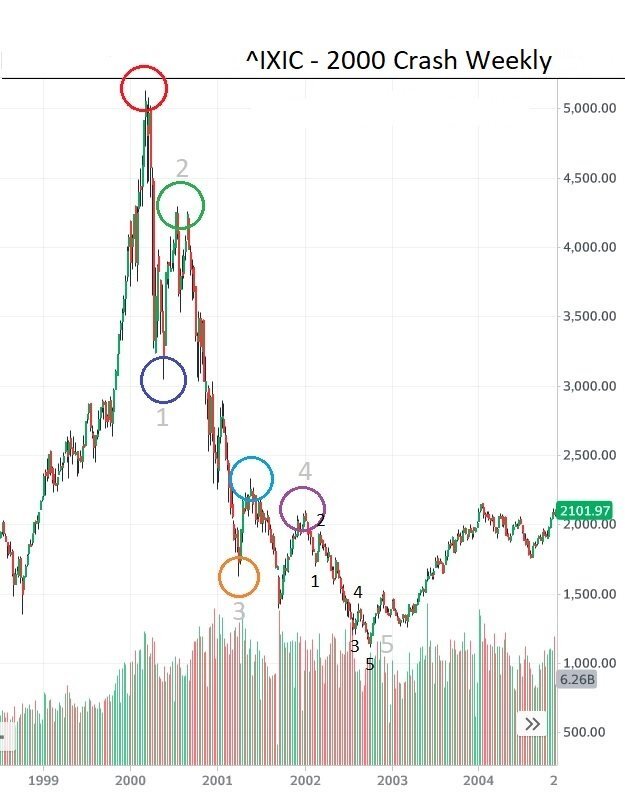
When I answered the question...I first took a close look at the full decline against the Nasdaq 2000 crash just as I did earlier today...
Here we have the 2000 Nasdaq crash on the left vs. ARKK on the right:
and then I jumped up into the topping formation itself to have a go against what I've been viewing in the ^DJI as it finishes it's second wave.
'Divide and Conquer', 'Wave Pattern Distortion', and Inversions...it's all right there for your viewing pleasure. Smile...
The ^DJI is on the left...ARKK on the right:
I also had several people asking about short funds.
I've commented on these leveraged funds several times now. I don't personally use this type of vehicle....and....anything over 1.5x leverage will never receive any form of endorsement from ol' CoinGuy. Although, I know people are going to do what they're going to do and they might as well do it with as much information as possible.
With that said...
I've discussed the following bottoming pattern with you in regards to the gold stocks bottoming back in '02/'03...and as of late in the ^TNX chart as well as what is about to take place in the ^HUI.
This is the chart I passed along to one of my former students...while telling him to pull back whatever he's looking at on the daily, make sure it has this formation, AND...that it's as fully developed as this pattern here. If it is?
Tight stops...even if they're mental stops.
I'm going to repeat myself in regards to this pattern. It is the most powerful bottoming pattern I personally know of. If you're reading this and you're young? Just spend the rest of your life hunting down this pattern...waiting with patience until it's fully developed...deposit a couple of seeds and then move on. If it's sector wide...just pick the two strongest issues within that sector and then move along.
April 13th is the opposite day of the year from?
I'll conclude with the ^HUI chart of the MOEX. Huh? What?
I'll repeat as I always do...
Think it through. Seriously...
Think it through. Always study. Never give up.
See you on the flipside...
The CoinGuy
WTF...
Take your time.
When viewing my charts...please understand that you're viewing a 'moving story' that unfolds one snapshot at a time...in time.
For those who even attempt at learning something...the dividends will grow and grow. For those who just take an occasional glance? That's fine, but you'll probably learn nothing.
What I discuss in my charts takes time to digest...it's worth every bite if you'll only take the time.
The secret to learning from me...is this. I give you the answers up front...and then deconstruct the problem until you can see it. That is why I gave you the Twin Peak reference chart BEFORE the pattern was developed.
I tell you this...because 'shortly', meaning later this year...I'm going to hit you with the next dose of insanity that will carry us another 18 months. I'm already working on the charts...
In the future...if you send me a note.
Just let me know if you want a private response or not(that goes for anyone). Just assume...if you don't say anything...the response will be public. I'm here for educational purposes...and I'll never pass up an opportunity to pass on 'a little insight' to everyone unless instructed otherwise.
The scary picture?
I want to see the suits response exactly where I've outlined(in the ^GSPC) before I start to pick up my brush and paint 'scary pictures'.
At this moment...I'm only showing what I do believe is possible, and quite probable. I, for one....would appreciate an exact repeat of 2008(when despite ALL patterning behavior that I am utilizing suggests otherwise?). Because, to me...that is the best case scenario.
These gentlemen in Washington are quite adept at kicking the can...perhaps they can go one more round?
Although...the consensus from 'my crowd' is not of certainty...but fear. The concern lies in what this country will look like if they do. Not if they don't.
Take care everyone...
The CoinGuy
WTF...
Now. Let's look at that ^HUI Chart from 2011 again? The right shoulder in this chart is truncated...but...as mentioned, there is no difference on the backside whether this particular peak is truncated...or not. The decline is the same.
Can you now see the 'larger fractal' from the ^XOI being represented here in the ^HUI?
What happens if we add the ^GSPC? The high in the box would represent the 'Non-Truncated' peak in the ^GSPC from January of 2022?
So...if I said. Christmas of 2018 is the head? You can begin to see why I've been saying all along we're heading back to the MAGNET? It doesn't matter how far you stretch the pattern...it will not break!
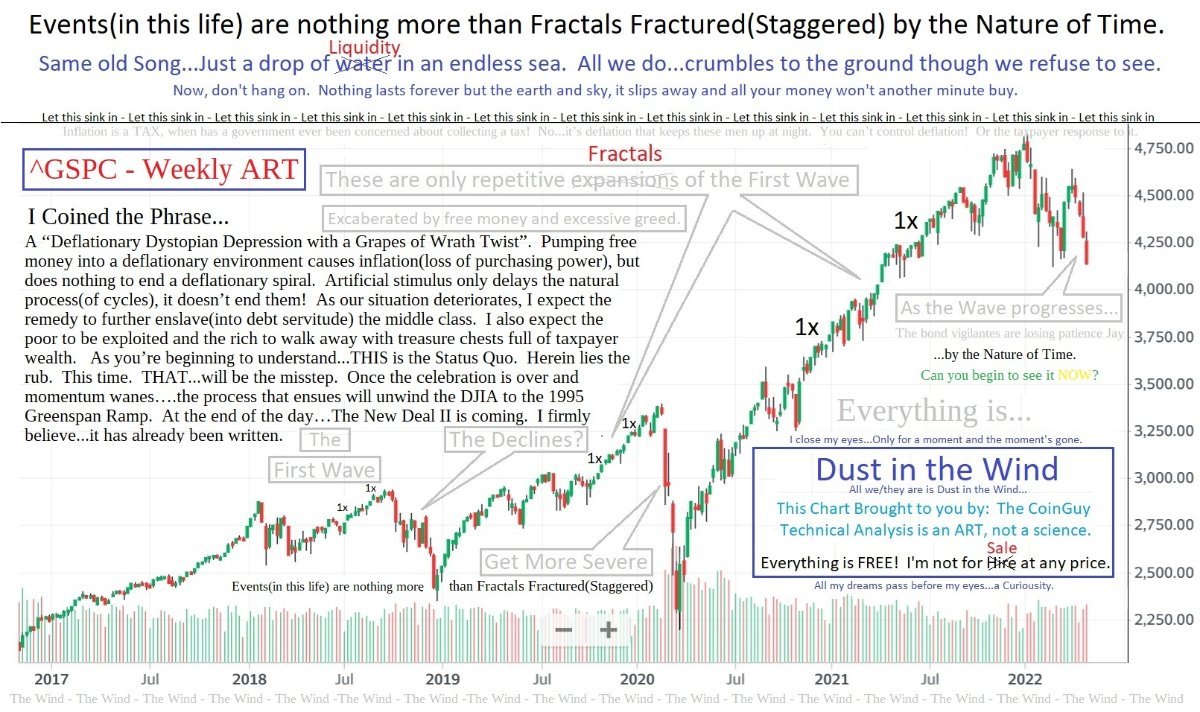
What is currently taking place in the ^GSPC actually started in 2000...
In the ^XOI...the pattern currently being played out is an 'echo' from what transpired in '07/'08. Just imagine a rock hitting the surface of a pond...this is a larger ripple of '07/'08.
I know you can see it now...smile.
I only wish that market participants would desire to understand the following statement:
1929 is the beginning of the left shoulder....74 is the head...and we just finished up the right shoulder at the close of 2021. For those familiar with my earlier illustrations in the tech crash stocks....1x/rest/1x. Go back and look at my The Beginning, The Middle, and The End charts and think...10x/rest/10x? Seriously...think that through!
"As you enter INTO the formation...in the same manner you shall LEAVE."
Best,
TCG
"On the XOI, are you looking at the weekly 9/18/2006-7/7/2008 and comparing it to the weekly 4/19/2021-today?"
Here is a weekly chart of the ^XOI.
Remember...both Doc and I have mentioned. Pattern's do not repeat...they rhyme. Why is that? It's because of the nature of patterns. No matter whether you're fulfilling a short term pattern on the daily...or you're zooming out and looking at the monthly. You're ALWAYS inside of a 'pattern...within a pattern' and the fractal always abides by the structure of the larger formation.
Can you begin to see it? To understand it?
In the ^XOI...If you're taking the rules of the larger formation into consideration...the 2020 lows are the MAGNET.
Now...let me take this one step further.
Perhaps...take what I've said and think ^GSPC?
WHY?
Put your thinking cap on!
If the decline in the ^GSPC is halted at 2,240 to 2,250(2020 MAGNET)...then you'll be setting up for one type of decline...and IF it barrels on through the MAGNET? Then...the end result is a 'numeric' structure that will resemble what I have just shown you in Natural Gas and ETH.
Think about that?
TCG
I'll add this chart for those not familiar with fifth waves in major crashes. This is the typical fifth wave coming off the "Twin Peaks" topping formation.
In the ^GSPC...you're just finishing the transition from the twin peaks(in 2) to the first wave of the 3rd wave of the decline. Get a position and hold on for dear life...is my best advice.
I took a look back to familiarize myself with the current discussion. I wish I hadn't. If I did have something to say...I would only be echoing the sentiments of PH and would note...well said, PH. If I was to add...
I know it is NOT easy, but always be slow to anger...and quick to apologize.
From my perspective. You're going to need each other going forward...
Now...more than ever...you need the ability to understand and comprehend the world around you from multiple perspectives. This isn't a weakness...but strength. Be forgiving...
Our perspective and awareness are much more limited than our ego's would confess...
TCG
oh...and...
WTF...anytime.
You know. There is NOTHING in this world I like more than questions. Give me a few minutes to mull that over...I'm going to head in to the archives and take a look at a few charts....I'll be back.
WTF...
As I posited on my post-it note. They're all broke and I mean ALL. Just as in '08...these collapses are only the pus oozing from those lurking in the "shadow's". Right here on my little tablet...I have a dozen "regionals" teetering on the edge right now. Although...as I look down...Pacwest is one of them. One(or two) money 'C'enter isn't looking too healthy either. Probably why I put up charts of both?
I don't think you'll mind?
When I got in this afternoon....I received your note. I hope you don't mind if I reply in public because I want everyone to benefit from the question you asked.
Which is...where is Henry Hub Natural Gas headed?
Would it be helpful if I just give you the answer in a picture?
Or...maybe I'll add a few words.
I mentioned over the last several months that the tech stocks(and crypto) were winding their way through 4th wave consolidation patterns while the broad markets were completing their topping pattern and setting up for their crash phase. Also known as...a 3rd wave decline.
Now. The reason I've taken a break is because you're not going to convince anyone of anything after they've taken a position...and your...time is up. So...this canary simply stopped singing. At this point, the best advice I can offer...is to clean up the trades you're wrong on quickly and simply...reverse course.
Going forward...
I'd imagine...if you're traveling with vehicles that would benefit from being short the broad markets...this would be your best vehicle at this time. Shorting the metals(with something like GDXD) or any of the sectors where you're traveling in a fifth wave...can turn around and bite you real quick. These are notorious for sharp rallies...and then folding over and resuming the decline with you sitting on the sidelines licking your wounds. Unless you know what you're doing...again...those issues traveling with the broad markets...are your best/safest vehicle.
You know...I harped on about ^XOI for quite some time and no one seemed to care. That index is in it deep. Stay away from anything associated with these sectors - for now.
Later on...when you're looking for bottoms. Just remember what I said. "Markets that run into trouble at 9.20 usually correct to one of three levels(with one variation). 1.30, .9, and .4(sometimes .45). Although, there is one variation...and that targets 1.00(+.10).
I'm going to make this very clear here. The broad markets at this time...like shooting fish in a barrel. Concentrate your efforts...there. Below 3810 is your confirmation...
In closing...take a good look at the chart. It IS the roadmap for the S&P 500. Just pull up a weekly and draw a line across 4,600....and start to think.
All. Markets. Are. Connected.
Best of Luck to All...
The CoinGuy
Hello Folks…
Thought I’d drop back in to the old stomping grounds.
Sad to see good ol’ Stool’s Gold in the condition it’s in. It appears to be dead. Although...appearances can be deceiving. Personally, I believe it’s only sleeping like a good bear should be. Once the bull in gold is back up and running strong, I’m sure the forum will be bustling with new(and old) posters alike.
If any old friends pass through, make sure to say hello.
I am still...
The CoinGuy