But it's not quite there yet as of 6:13 AM ET. The ES hourly 24 hour S&P futures chart needs to break below 4155 first. Then that would have a conventional measured move target of 4128. Whoop de doo. If it doesn't break down today, then they'll head higher into the FOMC picnic tomorrow.
There's a lot of news on the liquidity front, which I will address in a Liquidity Trader update tomorrow. Nothing urgent has changed as far as I can tell but I'm still parsing reams of Fed data to see if there's a nugget of insight somewhere that might open the lockbox of future secrets for us.
For now all we can do is follow the charts. And pray for guidance. And not the kind of guidance that comes from the Fed. Because it is flying blind. And lying about it. If there's one thing that Jerome Powell learned from the master, Bernanke, it's self exculpatory gaslighting.
When asked at his last dog and pony show if the Fed staff had warned the FOMC that any banks were in trouble, he cleared his throat and said, "I don't know. I'll have to get back to you on that." I instantly commented that that was a bald faced lie, and in the past week we got proof of that fact in the release of news of the Fed staff report that had been prepared months before that delineated point by point the exact problem the reporter asked about.
Not only is Jerome Powell incompetent. He is a crook. Not only is he a crook, he's a lousy liar. Biden should have fired the guy, but I guess he thought it good to have a useful, dishonest schemer, in charge of the Fed.
As bad as Powell is, Bernanke was worse. Bernanke was responsible for the financial genocide of millions of hard working, thrifty, honest, risk avoiding elderly Americans who had saved money all their lives just to earn a little interest income in retirement. Bernanke stole that from them and gave it to his Powells in private equity, at Wall Street banks, and big hedge funds.
Bernanke famously said in 2010, "Monetary policy has winners and losers." He chose his crooked cronies to be the winners, and simple, hardworking, honest people to be the losers. The man was a willful financial mass murderer. When it comes to financial holocausts, the soft spoken, even toned, studiously academic Bernanke epitomizes the banality of evil.
Yellen, despite her failings of insight, to her eternal credit, started a policy to start reversing the long term theft of savings. Unfortunately, she acted too late, and she moved cautiously and incrementally. When Powell came in, within a few months he doubled down on the Bernankist financial genocide. In doing so, Yellen's would be Volckerist legacy was destroyed and is forgotten.
By doubling down on QE and ZIRP Powell finished Bernanke's job of destroying the savings and lives of honest , risk averse, retired savers. The Fed first them of their rightful interest income and transferred it to speculators. Then many of those retired savers were forced to spend down their principal into penury. I saw that process first had in my own family. I'm would guess that you, or people you knew went through it as well. We know the truth of the devastating downside of ZIRP.
And now we see the devastating consequences of the aftermath. Finally, QE, and helicopter money in the pandemic set off the worst consumer price inflation in 40 years. Before that, we had the worst asset price inflation ever. But nobody seemed to mind that because supposedly everyone benefitted. Until it ended.
Now we have a consumption goods inflation that is robbing everybody, except debtors. And a real asset price deflation that is crushing debtors. Many of those debtors can't pay anymore, or if they can pay, the won't because they no longer have any equity to protect. It's gone. So those same big shots with uninsured deposits are running scared. The dominoes in the banking system are starting to fall.
We're in a holy mess. Neither the Fed, nor Janet Yellen's Treasury knows what to do about it. Yellen didn't make this mess, but now she and one of the wiseguys who did are in charge of cleaning it up.
There is no way.
It's a metastatic cancer. There's no surgical or medical cure. It will grow, and metastasize, until it finally kills the body politic in the US, and the rest of the world. The disaffected always turn to the siren call of the fascists. The cycle ends badly. Rebirth and renewal are too far over the horizon for many of us. The younger folks will need strength and courage and luck to get through what lies ahead.
We've been here before 100 years ago. The past is the future.
So what to do. Buy stocks, of course.
Seriously, if the ES doesn't break 4155 today. 😒
If you are a new visitor to the Stool, please register and join in! To post your observations and charts, and snide, but good-natured, comments, click here to register. Be sure to respond to the confirmation email which is sent instantly. If not in your inbox, check your spam folder.
For moron the markets, see:
Don’t Go Short if This One Thing Happens May 1, 2023
Swing Trade Chart Picks – The Future is One Word – Baking Soda April 26, 2023
Gold’s Lost Luster Will Shine Again April 25, 2023
Enjoy the Market Mirage Now Because We’re Really In a Desert April 24, 2023
The Fed’s Circle Jerk, is ‘Twerking? April 18, 2023
Here’s How We Know That Doom Has Already Arrived April 6, 2023
Macro Liquidity Says No Way Jerray! April 4, 2023
How to Play When Fed Changes the Game, Not Just the Rules March 19, 2023
Systemic Meltdown Under Way As Dead Bodies Finally Start Surfacing March 12, 2023
Here’s Why There Will Never Be Bull Markets Until This One Thing Happens February 26, 2023
If you're serious about the underlying forces of supply and demand that drive the markets, join me!
If you are a new visitor to the Stool, please register and join in! To post your observations and charts, and snide, but good-natured, comments, click here to register. Be sure to respond to the confirmation email which is sent instantly. If not in your inbox, check your spam folder.
In Germany, when crossing the street, everyone waits for the green walk light, even when there's no traffic.
France: Traffic light? What traffic light? Cars? What cars? Bah!
In German cities, cars have the right of way over pedestrians.
France: Cars? What cars? Bah!
In Germany if you want a glass of water with your meal, 3 euros.
France, 1 liter carafe ice cold tap water, corked, free.
In Germany, if you want ketchup with your burger or fries, €1.50 for a tablespoon. |
France free bowl of homemade ketchup from scratch.
German food: Fat and gristle
French food: Fat and more fat
Grocery stores in Germany: 1 per 3 square kilometers
France: 3 per square block
Fruit and vegetable stores and stands - France, 1 per block.
Germany: What is a fruit and vegetable stand? Vee haf REWE and ALDI.
Cafes in France- 10 per square kilometer
Germany - 12 per square kilometer
Coffee in French cafe: 3 tablespoons of strong espresso
Germany: Mug of dishwater, therefore Germans need more cafes than the French
Bakeries- tied, if you like pretzel bread.
Number of restaurants in French cities: A lot
German cities: More, the Germans apparently do not eat at home. More proof of that is the scarcity of grocery stores
Dinner Time in German towns: 5:30 PM (17:30). By 8:30 (20:30), everyone is home in bed. If you show up after 8 PM, too bad, restaurants and supermarkets are closed. You vill wait for breakfast, and you vill like it. Understood?
France: If you show up for dinner before 8 PM (20:00) you are rude and uncultured, probably American tourist.
That's your travel guide for today.
Back to the business at hand, yesterday's breakout on the hourly chart of the ES 24 hour S&P futures looked pretty convincing until it wasn't. Look where it stopped. Right at a key downtrend line.
Then it quickly fell back under a couple of resistance lines it had just broken. That was the Sell-Mortimer-Sell moment. Until it wasn't. Support broke, but that too was a false breakdown.
Old school conventional TA is a trap anymore. Now, first thing we must do when we see a break is look for the fake, because AI traders are smarter than we are. Apparently, only they know where we go from here, as the ES is at a maximum indecision point at of 5:15 AM NY time. Any trading between 4447 and 4497 will just be noise. Breaking one of those levels might be signal. Or maybe not.
The bulls have two factors in their favor. A 5 day cycle up phase should be starting. And hourly oscillators have mostly been making higher lows for a week, particularly versus last week's low. That doesn't mean that an upside breakout will follow, just that a downside breakout is less likely today than an upmove. But watch out if they take out 4447. Next likely stop, 4425.
Ciao for now. I'm going to Beethoven's house for lunch.
German Hamburger
More of my travel photos at https://www.instagram.com/200daysineurope/
For moron the markets, see:
Gold Sets Up August 8, 2023
All We Need is a Few Good Shorts August 7, 2023
Under the Big Top August 7, 2023
More Supply is Just a Lie But Withholding Weakens August 4, 2023
Let the Scary Pictures On Primary Dealer Financing Do the Talking July 31, 2023
Correlations Don’t Matter Until They Do, Like Now July 23, 2023
If you are a new visitor to the Stool, please register and join in! To post your observations and charts, and snide, but good-natured, comments, click here to register. Be sure to respond to the confirmation email which is sent instantly. If not in your inbox, check your spam folder.
Outfits like Apartment List and Zumper do market rent surveys all the time. They are reliable. The BLS data is a joke. I have warned for years that it would lag falling market rents on the way down and that CPI would be overstated as a result.
YEARS.
I have warned about it, and now it's happening. I have warned for years that the Fed was behind the curve on the way up and would be behind on the way down.
And it's happening. Just as I predicted. This is NOT rocket science. I was a commercial real estate appraiser and market analcyst for a long time. I know how to measure rents. The private market rent surveys are accurate. I have no doubt about that. These companies collect reams of data. Big Data is self correcting. Anomalies are averaged out.
I knew rent inflation in recent years was pushing real inflation higher faster than the Fed recognized. And I am not surprised in the least that rents are falling now, and that the Fed hasn't got a clue.
Because the government methodology is flat out fraud.
CPI was never intended to measure inflation. Its purpose was to index labor contracts to the "cost of living." So the government invented all kinds of contortions to suppress the number. Worked great on the way up, but the same methods result in overstatement on the way down.
Of course rents are adjusting. They went up too far, too fast. People can't pay. Too much multifamily rental stock came on the market. Boom, now rents are falling or at least aren't going up.
The whole system of measuring "inflation" is a joke.
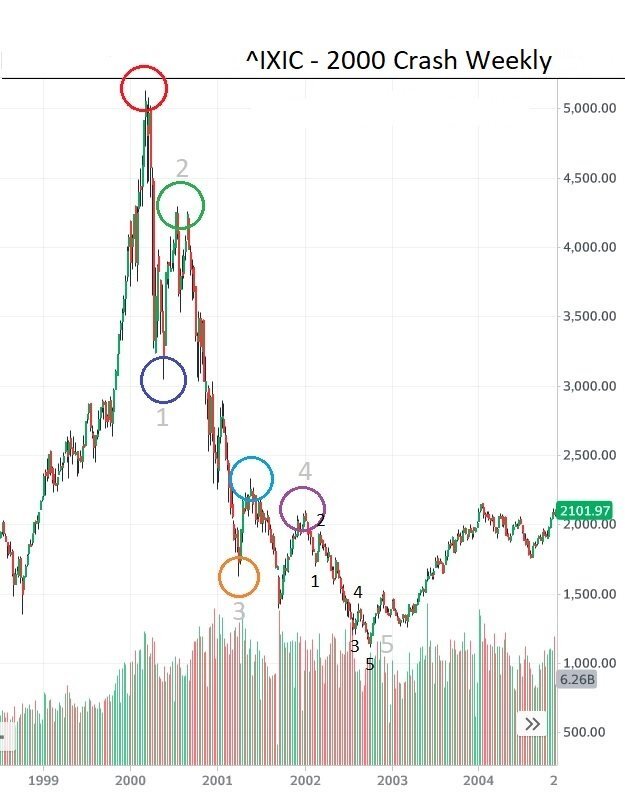
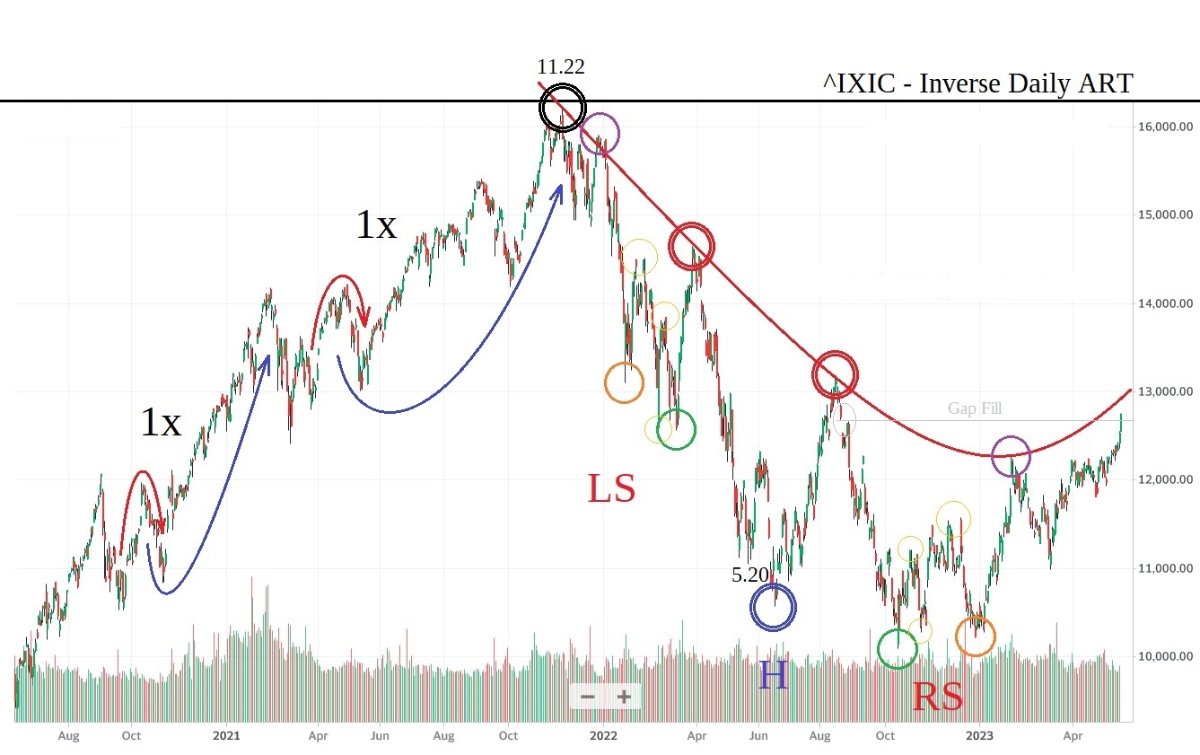
I'll add this chart for those not familiar with fifth waves in major crashes. This is the typical fifth wave coming off the "Twin Peaks" topping formation.
In the ^GSPC...you're just finishing the transition from the twin peaks(in 2) to the first wave of the 3rd wave of the decline. Get a position and hold on for dear life...is my best advice.
I took a look back to familiarize myself with the current discussion. I wish I hadn't. If I did have something to say...I would only be echoing the sentiments of PH and would note...well said, PH. If I was to add...
I know it is NOT easy, but always be slow to anger...and quick to apologize.
From my perspective. You're going to need each other going forward...
Now...more than ever...you need the ability to understand and comprehend the world around you from multiple perspectives. This isn't a weakness...but strength. Be forgiving...
Our perspective and awareness are much more limited than our ego's would confess...
TCG
oh...and...
WTF...anytime.
You know. There is NOTHING in this world I like more than questions. Give me a few minutes to mull that over...I'm going to head in to the archives and take a look at a few charts....I'll be back.
Sigh.
For someone who worked for GS, that guy's ignorance is astounding.
BILLS ARE ALWAYS PAID DOWN IN APRIL AND MAY. ALWAYS WITHOUT EXCEPTION. Net bill paydown of $245 B is light. Last year was an exception because the lifted the debt ceiling after Treasury cash hit zero so they had net issuance. 2022 $360B paydowns. 2021 $412 B.
And the RRPs were being withdrawn in December with virtually no net issuance.
I just hope democracy prevails in the US. An authoritarian US under Trump would be an unprecedented danger for the world. Can you imagine a Trump/Putin axis?
And how will the US military respond to illegal orders this time?
What about the Justice Department? Will it become the Trump Police, arresting and jailing his political enemies? Trump has threatened to root out the liberal vermin.
My observation has been that it isn't necessary to anticipate. The market responds to actual changes in liquidity. To the extent that some correctly anticipate the change, the advantage is too small to be worth the risk, in my opinion. The vast bulk of the move, i.e. the trend, happens on the actuality of the liquidity flow, not the anticipation of it.
In fact, if you look at the 2020 Covid bull turn, it came 8 days AFTER the Fed started massive pumping operations.
Yes, and when on their way to zero, they are culled from the market averages. Can you imagine where the S&P would be if all of them were left in the index? And not replaced with newer, growing businesses?
I'm going to leave this for an old friend.
The topping pattern at the conclusion of a supercycle is going to resemble all the topping patterns before it. We are currently playing out the peak from '08 with extreme precision. Although...it does not stop there.
That was only the beginning...
Here is a current chart of the ^GSPC with an arrow at the 8.16.22 peak.
Then...I'm going to take the peak from 8.16.22 and reverse it. Why? With the next chart...it should become clear.
Then...I'm going to repeat my statement from early in 2022, but change the date to another period in time.
"Was 2000 all that long ago?"
Here is the truth.
"Only a supercycle event WILL PRODUCE the secondary decline." This is why Russia MUST be monitored closely...it is the leader of this cycle. Whatever happens to them WILL happen to ALL other markets in the world. I am 100% convinced that their market is a foreshadow of things to come...
They are currently two steps ahead of our market's here in the US. If they eventually take out their recent lows...the target is 425(+25/-25). If they don't...a stick save may be produced. Although...at this time...I do not believe this to be the case. I also believe the sticksave in the US will only worsen the situation...eventually. We shall see...soon. Our 2.17 to 2.24 Moex decline phase in the US is currently underway. There is no waiting to see if I'm incorrect...it started when I said it did back in July.
Now. Let's get back to discussing the peak in the chart above.
Think about Gold in this timeframe I have outlined in the chart above...where(and why) did it separate?
For you this should be like a walk in the park...don't strive so hard.
One day at a time...Patience.
Ok...2,240 to 2,250 it is.
TCG
oh...and...
For those who like gold stars...
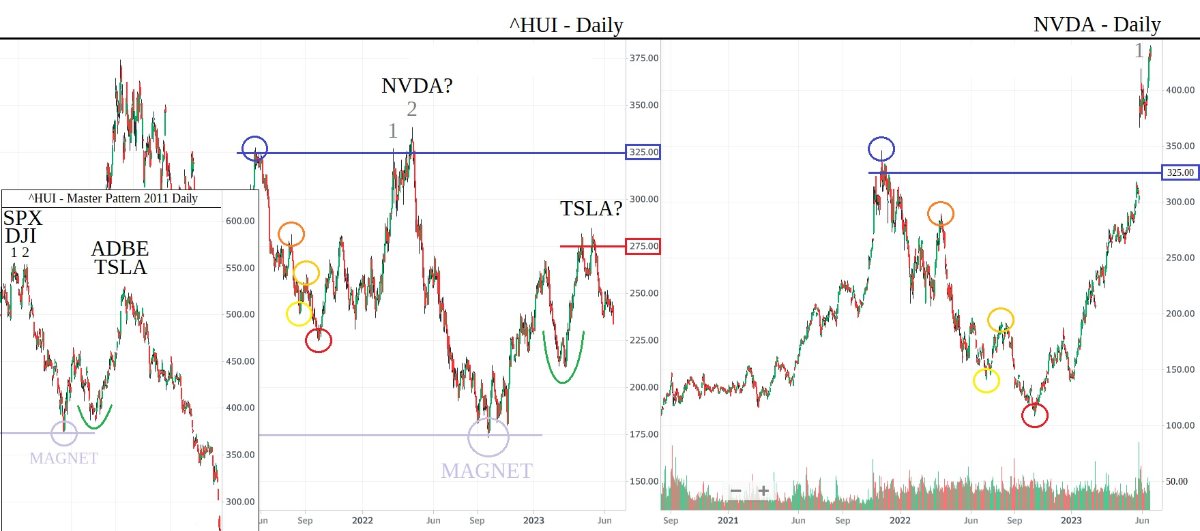
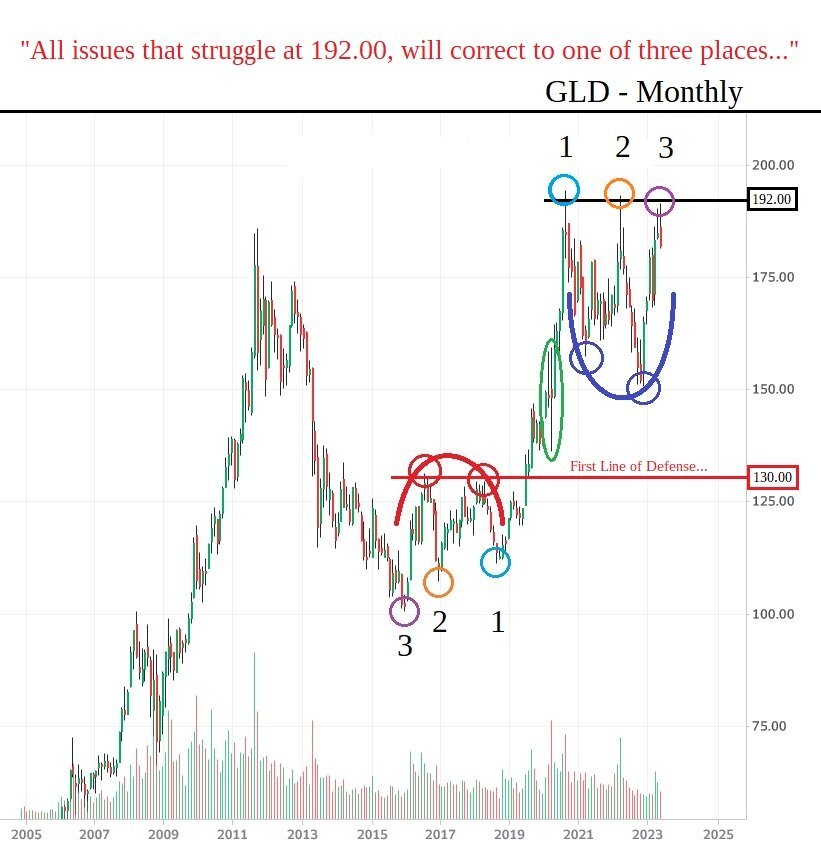
You see those three peaks in the GLD on the right side of the chart in the post above this one? Notice how the peak is on the left side, then the secondary peak is lower...and the third peak is lower still? Strange? No. It's telling...very telling. Now. Go over to TSLA and look at those three peaks in late 2021 and early 2022? Where did the primary decline bottom? 100?
Think! Study! Never Give Up!
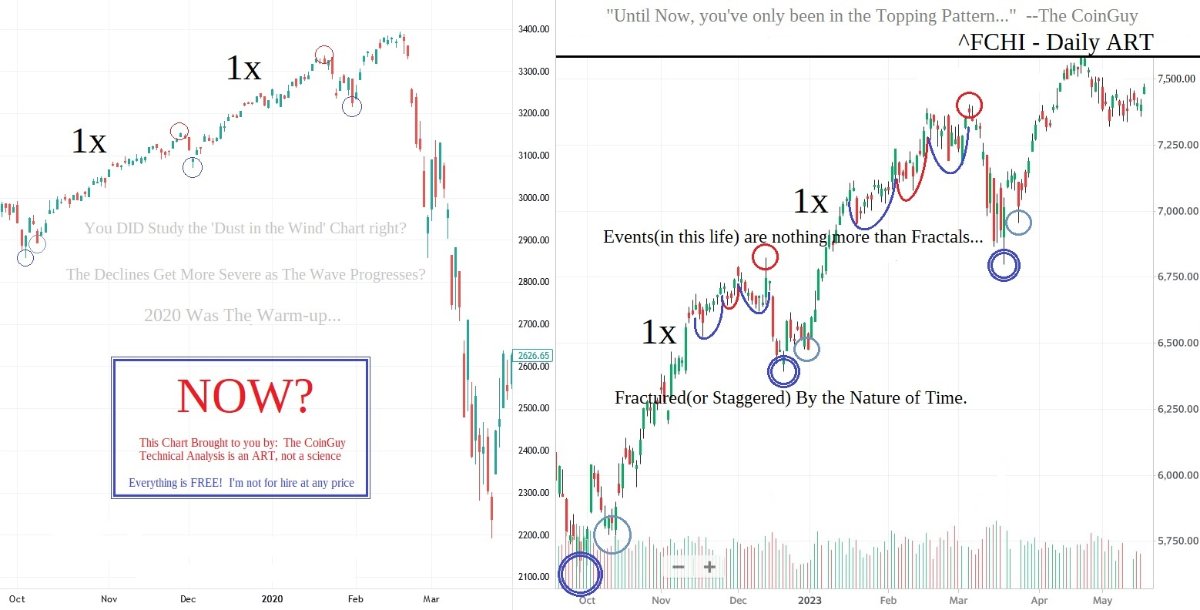
If a person would only study the "Dust in the Wind" Chart...
Our current set of peaks in 2000, 2008, and 2022...are only echoes of other peaks - in time.
It's so beautiful I cried as I put that chart together. No one even took a look.
The future...is right there in front of your eyes. Yet you refuse to see it...
Again.
Think!
Study!
Never Give Up!
So. What is the GLD telling you with it's lower successive peaks? It's nesting for a primary 3rd wave crash. Just flip the chart and rotate it 180...it's quite easy to see.
NVDS.
It's not too late.
😉
Gotta run...
TCG
oh...and...
I felt bad having left without mentioning gold and silver.
You're now BACK on the trendline. The break through will cause acceleration...
In the pit of despair...a new bull market in the metals will be born. Since most people that trade gold don't understand it...and they sure as hell don't understand silver either...I'll mention this.
When GOLD slips into a free fall(not silver or the shares), then you KNOW the end is near.
I warned early...and I warned often.
I don't want to leave gold on this note...
I'm going to add this. From day one...I said Gold was in a bubble did I not?
If I post this chart here with two date labels on the peaks and tell you to think of the S&P...does it give you a direct connection to my internal dialog?
THINK IT THROUGH to its conclusion...
2009...will...come my fellow goldbugs.
Quickly.
The reality of my wall at 1,920 has to play out first. Then. It's Blue Skies.
Gold will not go despite the efforts of the current goldbugs, which is a group I personally reject...it will go up despite them. The fight will come at 100.
I will take on all comers...
NOW...you understand the path.
All YOU have to do...is Believe.
Simply...believe.
technically it's correct. But it ignores the fact that the creation of close to a trillion in T-bills creates a hell of a lot of collateral. Borrowing against that collateral creates money. That private money creation is currently outstripping the draining effect of QT and The rebuilding of the Treasury account. So it's not that the market is ignoring those, in my opinion it is feeding on that collateral.
At some point this process is going to reverse. Our job is to figure out when that is.
I caught up with my train in Berlin so I'm almost in Leipzig. due to arrive at 18:42. And then I'll walk to my hotel. A long day. Just another experience in travel. 😊
I can guarantee that this will ultimately end very badly, but I don't know when yet. I guess it depends on the RRP fund. How long it takes to get drawn down to a level where it stops, or where the Fed is forced to actually raise the RRP rate above the market rate so that the money stops coming out.
Another certainty is that inflation is only in a pause. It will come roaring back as the economy overheats.
The whole world is perfectly aligned for Russia! Russia! Russia!
FTW...
Going forward. Please remember/recall the two themes. "All issues that stumble at 192" and "So. About Half?"
Don't think for a second that I forgot...
I owe you a Gold Star chart.
Don't be turned off by the rough appearance...there is a gem inside. This IS the most potent chart I have publicly posted.
The consolidation "in the ^DJI" from January 26, 2018 to the peak on February 12, 2020(747d) right before the pandemic crash is the left...and...from the January 5th, 2022 peak until this very day(555d)....is the right side. Understanding wave pattern distortion(and you should have at least a basic comprehension by now), you might begin to SEE they are nothing more than a mirror image of one another.
Subtract right from left?
Speaking of mirror images. In my last post entitled..."Real Answers to Real Questions".
June 16 - June 30 - July 14.
"As you enter into the formation...in the same manner you shall leave."
This CAN apply to time as well...
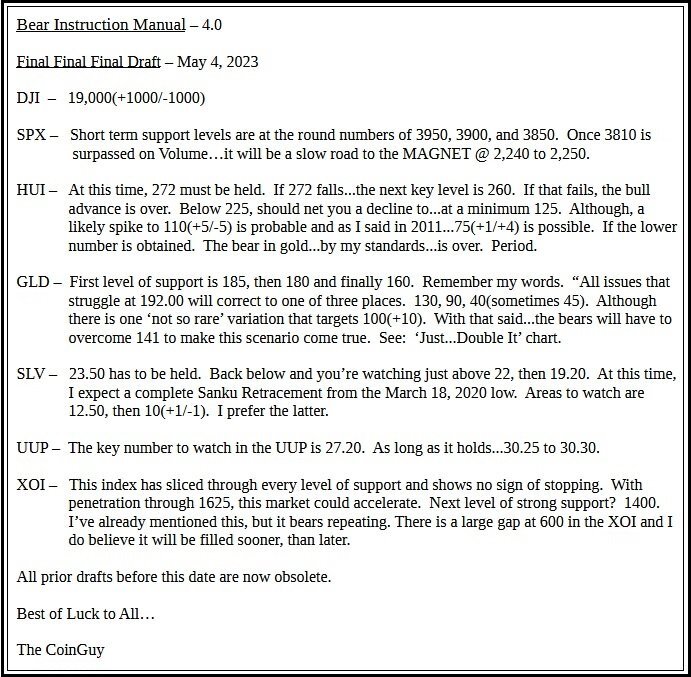
Bear Instruction Manual 5.0
I did look over the BIM 5.0, no changes are necessary. All numbers are good, but I will comment that SLV/GLD are in the throes of a crash...avoid this area at all costs. With the SPX, I've already mentioned it many times. Wait until 4460, then 4410 is given up on volume.
In ALL Things...Patience.
TCG
Think this through. Study. Never Give Up!
I'll drop in at 2,240 to 2,250 on the SPX.
Oh...and...
Would this clear up the question everyone is afraid to ask?
2.24 + 2.24 = 5.18
See you then.
Exactly. As I pointed out in my report with the Fed constantly draining this is not indefinitely sustainable. The Fed will win this battle too. And the collateral damage will be enormous.
That’s right. It’s not the Fed any more. This ain’t the QE era. Non-subscribers, click here for access.
Subscribers, click here to download the report.
The stock market has mounted a seemingly sustained rally despite the fact that the Fed continues to steadily withdraw money (aka liquidity) from the financial system. Non-subscribers, click here for access.
This is not the good old QE days when the Fed steadily pumped money into the system, and we knew that the market would always rise, except when the Fed paused its pumping. We saw a market hiccup under Janet Yellen’s balance sheet shrinkage program in 2018, but then Panic Jerry set new standards of QE pumping in 2019 and 2020. Non-subscribers, click here for access.
I thought that once the new QT started that the market would be mostly bearish, with occasional rallies. Uh huh. Not. Non-subscribers, click here for access.
I am reminded that in the pre QE days of blessed memory that we often had bull markets with the Fed managing balance sheet growth at a nominal pace of 2-5% per year, year in and year out. But even that is different from today when, yes Virginia, there really is a QT, and the Fed really is shrinking its balance sheet. Except when it isn’t. Non-subscribers, click here for access.
Alas, the world is not so simple any more. The system can, when investors and bankers are of a single mind, create ample liquidity on its own simply by self-expanding credit. Bankers can decide to offer more credit. Investors can decide to use it. Non-subscribers, click here for access.
Or if asset prices, in this case stock prices, start rising far enough for long enough, players at the stock tables can simply decide to do it on their own. That includes not just the big investors and traders at the tables, but also the dealers running the games. Everybody winks and gets in on the winning action. Prices rise. Rising collateral value means more margin is available. Traders borrow against it. And away we go. Non-subscribers, click here for access.
Today the market has an added bonus: massive T-bill issuance by the US Treasury. Here’s where things get perverse. I had expected, wrongly, that the enormous supply would put downward pressure on all asset prices as the market was forced to absorb the new T-bill supply that would come when the debt ceiling was lifted. But my analysis was faulty. Non-subscribers, click here for access.
Two things happened that I did not expect. Fortunately, the technical analysis (TA) that I do in tandem with the liquidity side told me a few months ago that it was time to get long stocks. So I followed the TA, while trying to guess at what the liquidity source would be. This was just the opposite of the way things worked under QE, when we knew exactly what the source was, how much was coming and when. The TA naturally followed. Non-subscribers, click here for access.
The first thing that happened is that the big hedge funds hedged away the likelihood that Treasury note and bond prices would fall when the wave of new supply was released onto the market. So far that hedge has worked, by preventing bond prices from falling. I do not think that hedge will work indefinitely, but for now it is, and that’s all they needed to continue speculating on the long side in stocks. Non-subscribers, click here for access.
The second thing that happened, which I neglected to consider in my initial analysis of what would happen when the debt ceiling was lifted, is that T-bills are perfect collateral. They can instantly be used as collateral for repos — repurchase agreements (RPs) – which are very short term loans from banks or the Fed for nearly 100% of the face value of the T-bills. And use it, they have. Non-subscribers, click here for access.
At the same time, money market funds had over $2.3 trillion sitting in the Fed’s Reverse Repo (RRP) slush fund back in April. The Fed’s RRP program takes in excess cash from dealers, banks, and particularly money market funds. I had long noted that it would be used at some point to fund absorption of Treasury issuance and possible to support a rally in stocks. I had warned in these pages for the past year and a half that when the RRP started to decline, look out for stocks to rally. Non-subscribers, click here for access.
Voila, here we are. As of Monday, July 3, cash in the RRP slush fund had dropped from $2.275 trillion on May 22 to $1.909 trillion. That’s $356 billion in cash that came out of the RRPs to fund the absorption of the T-bill issuance. Those T-bills became collateral for an increase of private bank to dealer and bank to hedge fund RPs, instantly creating a massive amount of new credit for players to play with. And play they did. Non-subscribers, click here for access.
So here we are in a brave new world of automatic, self-created market finance, which will be indefinitely funded by the issuance of new Treasury securities. The tidal wave of $600 billion of new issuance in 2 months post debt ceiling suspension will slow after July. But we can still expect an average of $100 billion per month in issuance. And instead of new supply always pressuring the market, we must face the fact that the dealers and gamblers at the tables can, at will, increase the use of virtually automatic credit whenever they want to. The T-bills will provide the fodder. Non-subscribers, click here for access.
Is this system infinite and unbreakable? Of course not. The longer this goes on and the bigger it gets, the more fragile it becomes…Especially because the Fed, the ECB and BoJ are still working to control inflation. The Fed will continue to shrink its balance sheet, withdrawing cash from the banking system. Its two cohorts are a little less predictable, particularly the BoJ, but as long as the inflation numbers continue to run hot around the world, then the central banks will continue to attempt to drain money from the system by shrinking their balance sheets. Non-subscribers, click here for access.
So there’s that as an offset to the will of the players to continue borrowing and leveraging to drive asset prices higher. This rally will end, and it is likely to end hard, in tears. But for now, we can’t see from liquidity alone, when that will be. There are some things that suggest that the time is growing near for the first big correction. I will continue to monitor the liquidity measures for any hints of reversal, but as always, the technical analysis will determine when we should change tactics, even if, in this new world, it’s not always clear why, at first. Non-subscribers, click here for access.
In this report I present the most current banking, money market fund, and Fed balance sheet charts to illustrate what’s going on, and give us a leg up on specifically what to expect and look out for in the stock and bond markets. Non-subscribers, click here for access.
Subscribers, click here to download the report.
KNOW WHAT’S HAPPENING NOW, before the Street does, read Lee Adler’s Liquidity Trader risk free for 90 days! Act on real-time reality!
Meanwhile, back in day trading land, we have a little bitty break in the ES 24 hour S&P futures. The hourly chart has a 5 day cycle projection of 4432, already done. 4430 and 4425 are sport levels. If they don't hold, I'd look for 4415.
For moron the markets, see:
It’s Not Your Daddy’s Liquidity Anymore July 5, 2023
June Was Stellar but Whiplash Injury Hurt July 3, 2023
Growing Stronger Every Day July 3, 2023
We Now Know What is Driving the Rally June 20, 2023
Gold Gets Nearer Important Cycle Lows June 18, 2023
The Fed’s Slush Fund is Working June 16, 2023
Investors Breathe Sigh of Relief But D-Day Is Now June 6, 2023
Incomprehensible, That’s What You Are June 2, 2023
Modestly Hedged Dealers, Record Short Hedge Funds Suggest Disaster Ahead May 25, 2023
If you are a new visitor to the Stool, please register and join in! To post your observations and charts, and snide, but good-natured, comments, click here to register. Be sure to respond to the confirmation email which is sent instantly. If not in your inbox, check your spam folder.
My travel photo blog
"FTW...from my perspective, I've done you a bit of a disservice answering your questions in the manner that I have, which is without illustrations. Therefore...you'll see a post on the thread soon."
From our discussion on the ^VIX...
I also reviewed the other questions we discussed...
I'll add two simple charts and follow it up with 'One Step Ahead'.
Quick comparison from the Tech Wreck in 2000 vs today in the ^DJI...
Then...stretching the triangle as we discussed. Trading range bound while within the pattern. What pattern? See next chart...
I'll ask. How many days from 11.04 to 6.16? As always...please remember. The MAGNET is only the first 'small' step. Like I've said...This isn't a one and done like 2008.
I've also said since day one...The tech stocks are "One Step Ahead" of the broad markets.
That's ARKK on the left...and the ^DJI on the right.
I'll have more when the TIME is right. I see zero reason to get ahead of the market, er, uh...the Fed.
In closing...
Recession? I planned for a 14 year Worldwide Depression. As far as I'm concerned...we're right on schedule.
Oh...yeah, I forgot. Happy Birthday Will's. You survived your 40th!
Now...only 13 years left.
The CoinGuy
oh...and...
STOP CHASING UNICORNS!
This give you any ideas?
The final push I discussed at 275 is just about complete. As promised...I'll join you in NVDS when you're back below 400. Target price for NVDA has not changed. 50 bucks...and change.
I noticed accuracy levels in your stock pickings have fallen off since I left PC&A's corral, mr. neighbor. If you keep playing in my playground...you're going to lose a few fingers.
It is all coming into view yet?
There's a lot of stuff out there that purports to be economic, monetary, and liquidity analysis. I don't read other people's stuff. There's no point. Markets don't anticipate and they don't discount the future. Anyone who successfully anticipates a big change in the market more often than not is just lucky. Very few people do it more than once. They become very famous, often living on past laurels, not repeating their success, but not needing to.
It's not a chess game. Chess involves planning. Markets involve random, usually unknowable human responses to the attempts of policy makers to direct and channel what is inherently chaos. If you try to anticipate, well, they're gonna make this move, and that will be the response and then they'll make that move and then this will be the next response... I mean, come on. Get real.
Follow the data. Don't overthink, and don't make shit up and you'll be fine.
So what if you miss a major turn by 3 weeks. You won't be betting wrong and losing money for 6 months or a couple of years before. More money is lost by being too early than by being a little late.
When I do macro liquidity analysis, all I want to do, and can do, is try to correctly identify the existing trend or trends, and try to notice when they are changing. If we are paying attention, then we'll see the signs of change as they begin to crop up. So you won't be too late.
I see signs of it now in the latest data. It's early, but change is coming. Modestly Hedged Dealers, Record Short Hedge Funds Suggest Disaster Ahead But the most important fact is that liquidity analysis merely sets the context. Knowing context is what helps us to better understand and act on the technical charts in the right direction at the right time.
Meanwhile, we focus here on the day to day. The ES 24 hour S&P fuguetures are our muse. They're due for 3 and 5 day cycle highs this morning. But we can't rule out an extension. Another triangle is forming that should signal what comes next. The top line falls from 4164 to 4161 today. The lower line rises from 4145 to 4161. Break either of those lines, and we have a signal as to what's likely for the next really big move. I mean, could be as much as 3 or 4 points.
In other words, why expect follow through now, when we haven't had any since time immemorial? OK, ok, if they clear 4155 with momo, then there's a conventional measured move target of 4205. To get there, they'd need to clear trend resistance at 4163, and the pivot high of 4166.
4161 is the Dick Trickle Memorial Point, and it's due at the end of regular trading in New York. Would be a fitting end to the day. Non Functional GPS Market
Meanwhile the 10 year Treasury yield marches toward its measured move target of 3.92, which is about where it would also run into trend resistance. Hell! Why stop there? Modestly Hedged Dealers, Record Short Hedge Funds Suggest Disaster Ahead
Meanwhile, gold, the standard bearer of the eternal flame of unrequited love has come down to a big trend sport line. Will this be the day it finally says yes, it will marry you? Let's see. Gold’s Immaculate Correction
For moron the markets, see:
Modestly Hedged Dealers, Record Short Hedge Funds Suggest Disaster AheadMay 25, 2023
Non Functional GPS Market May 22, 2023
Swing Trade Chart Picks – Let’s Get Ready to Rumble May 18, 2023
Gold’s Immaculate Correction May 19, 2023
The Most Widely Forecast Economic Disaster In History May 16, 2023
Weak Real Time Withholding Taxes Set Up a Showdown May 4, 2023
The Big One is Coming May 3, 2023
If you are a new visitor to the Stool, please register and join in! To post your observations and charts, and snide, but good-natured, comments, click here to register. Be sure to respond to the confirmation email which is sent instantly. If not in your inbox, check your spam folder.
If you're serious about the underlying forces of supply and demand that drive the markets, join me!
One final chart as we head into the weekend.
It's not over. It hasn't even started yet...
Sixteen Times Twelve Is?:
Over a decade later and the ^HUI is still looking for a bottom...
Best Regards,
The CoinGuy
Gotta trade the charts. Even there, I'm finding the edge to be significantly less than in the past. It's frustrating.
Perhaps much of the blame for this market can be place with the fact that shorts are their own worst enema.
On that note, I bid you a bonne weak end, Bonne nuit et bonne chance!
I leave for a couple of days and the Bulls have completely destroyed the China Shop...
It appears as though I'll be playing the part of the Bear this go around. Claws and all...
After all it's nice to have someone to point fingers at and chuckle...although, it does prevent some from turning inward and taking a good long look at their own behavior.
Of course....I'm not speaking to any of you fine gentlemen.
I see the 'move to dishearten the bears' has brought the 'emboldened' bulls out in force. Although, calling a sideways consolidation since the October lows...a bull market...is a bit of a stretch? We've been going sideways for what, almost a year now? No matter...I'll run with the idea.
If the ^GSPC can steamroll through 4310(and hold it), I'll be joining you on your quest.
I was actually inspired to see the Nasdaq clean out that gap...and since the ^GSPC is so close...I'd like to see it follow suit. Then...I consider this 'bull market', over. Now. If 4310 is pierced and can be held on Volume. I will gladly accept that I've been incorrect and pick up a spud peeler. I prefer the swiss peeler, Kuhn Rikon...and I have it at the ready.
Until then...let's see how it goes. I think the turn is coming in about right now, meaning today. Although, perhaps as soon as Monday? Although, it's never Mondays? Is it?
Here is the aforementioned gap in the SPX:
I'd like to see it fill...and then this market roll over like a good dog.
Twin Peaks Formation Reference Chart
Despite, what? A year of constant harping and 25-30 charts outlining the Twin Peaks Formation from every angle possible, not a single taker?
Ok...
Since I spent time completing the chart below, I'll post it and then just tuck away the 'Twin Peaks' for another time.
Again. From my perspective...we're in nothing more than a simple 'Twin Peaks' topping formation and have never left.
You're finishing up the secondary peak now...
At the Turn...if the Pattern isn't breaking...you're dead wrong.
I've been watching the DAX(and the Nikkei) very closely. The reason is... with this apparent attempt at a new all time high on the DAX you're on the verge of breaking the pattern I outlined in my previous chart a week or two back. The CAC40 is still acting correctly, but the DAX...if it continues and can hold it. This is another place where you can also force a mea culpa from Ol' CoinGuy.
Although, It's not over...until it's over.
You know...I can remember the DAX having made a double top...and then a couple of years later it made another attempt at piercing that double peak just like it is today. Let's see...when was that? Right before the Pandemic Crash.
I have zero doubt it will repeat...
This time around, let's take a look at the CAC40 against our ol' favorite...BTC.
and then follow it up with...NOW?:
Since I mentioned the Nikkei, I'll add this. The ^N225 is dancing on the edge.
YOU may see the Nikkei...I see the DAX!
Ahh...The symmetry of a 'completed pattern'.
Then, we have that gap fill in the Nasdaq and as I've said many times. One day means nothing, it has to hold the area and on Volume.
Probing into a region, while it can be exciting...it has to hold the ground it just took.
If it can't? Simply put...it's over.
Same as the SPX, if the Nasdaq can pierce through and hold 13,200...I'll join you.
Why?
"Because that is the difference between a consolidation...and a continuation."
I can only hope that you take the time to think that through...
I'll close with this...
We've been treated to the 'appearance' of Gold & Silver trading inverse to the Stock Market since the October lows...nothing could be further from the truth.
Two Peas in a Pod:
Going forward from here. They will both continue to travel together until the magnet in the ^GSPC has been reached.
Then?
Blue Skies for one.
The other?
Green Shoots that eventually die of starvation(from lack of liquidity)...
"When you say you'll bail everyone out...the first test of that theory isn't far behind."
Best Regards,
The CoinGuy
oh...and...
For your convenience...
'Dust in the Wind' from the archives:
Doc: For those who don't have social media accounts...Please consider continuing to post a few pictures on-site.
And...have a great time.
I actually admire the French. While Americans sit on their couches....the French go into the street.
SiP: Excellent photography.
JIMBO: I don't comment on your posts as much as I should, but I do enjoy reading them. All of them.
I do believe Warren is holding cash(or cash equivalents) for the same reason I am.
In fact...I can remember only two people in the whole world who were very vocal about mentioning this at the beginning of 2022.
Both are members of this forum.
TCG
oh...and...
My fellow goldbugs...
Remember what I said. This market simply cannot pause here. It has to continue going upward and to the right. ANY strength back below 275(especially if it tanks below 272 on Volume) - protect yourself. Nesting cups at peaks/valleys usually ends in tears. This is NOT the time to be playing games.
Below 260? It's over.
For those in the ^GSPC. Don't lose sight of the 'left peak' high on February 2nd. A move above 4195.44 might temporarily slow down any market bearishness...
If it fails to overcome the swing? After all the charts I've posted...I don't think there is any further need to elaborate.
There are rumors everywhere...but only The Shadow(Banks) Know(s).
From October 13th to May 1st is how many days?
I looked through the archives here on Capitalstool and my archives on our server. I posted here up until the 21st of April. Most of the charts I've produced since have been for private consumption...but I have a few I can toss out there. You might get something out of them...you might not.
I have a file folder on the server called "ROUGH"...it's where I keep my rough drafts of what I plan on expanding on in the future. I saw something in there that caught my eye. It has to do with the ^HUI...I'll come back at a later time when I've developed the chart and have a comment or two.
Ok...Onto a chart or three...maybe even half a dozen.
I'm just going to start commenting and I'm going to keep commenting 'off the cuff' until I get tired. When I'm tired? I'll see you somewhere down the road.
I believe I've already mentioned I have several former students who like to hang around the 'nest'.
The conversation as of late has been centered around the banks. Bank of America(BAC) has been coming up more than most for some reason. Probably because of the weakness being displayed in the chart. I think they're seeing vulnerability here...
Out of the larger banks...it's toward the leading edge in this current decline. Especially when I start to consider the 'shadow banking' system. You know...the guys in the background? Although, most have not crossed the line of no return - yet.
I repeatedly made sure you were aware of this line back when BTC and ETH were sitting just above the edge. Now...I'm showing you BLK straddling the same line.
With that said...here is a chart of BTC in a comparison chart against BLK. Before viewing this chart though...please recall my recent introduction to...Wave Pattern Distortion. This. Is a perfect example.
The chart is a couple of weeks old now...and...we're currently drawing near to the line. Once broken...under 400 is where she ought to come in for a nice landing. Oh...and BAC? Anything south of 17.50 means serious trouble.
Since we've mentioned BTC, I'll toss out this chart of the Russell 2000. Better be watching that line carefully...
I had someone ask me about tech. I believe during the beginning phases of the tech wreck, the ARK Innovation ETF was mentioned daily as some form of poster child for the excess coming out of the 2020 lows.
When I answered the question...I first took a close look at the full decline against the Nasdaq 2000 crash just as I did earlier today...
Here we have the 2000 Nasdaq crash on the left vs. ARKK on the right:
and then I jumped up into the topping formation itself to have a go against what I've been viewing in the ^DJI as it finishes it's second wave.
'Divide and Conquer', 'Wave Pattern Distortion', and Inversions...it's all right there for your viewing pleasure. Smile...
The ^DJI is on the left...ARKK on the right:
I also had several people asking about short funds.
I've commented on these leveraged funds several times now. I don't personally use this type of vehicle....and....anything over 1.5x leverage will never receive any form of endorsement from ol' CoinGuy. Although, I know people are going to do what they're going to do and they might as well do it with as much information as possible.
With that said...
I've discussed the following bottoming pattern with you in regards to the gold stocks bottoming back in '02/'03...and as of late in the ^TNX chart as well as what is about to take place in the ^HUI.
This is the chart I passed along to one of my former students...while telling him to pull back whatever he's looking at on the daily, make sure it has this formation, AND...that it's as fully developed as this pattern here. If it is?
Tight stops...even if they're mental stops.
I'm going to repeat myself in regards to this pattern. It is the most powerful bottoming pattern I personally know of. If you're reading this and you're young? Just spend the rest of your life hunting down this pattern...waiting with patience until it's fully developed...deposit a couple of seeds and then move on. If it's sector wide...just pick the two strongest issues within that sector and then move along.
April 13th is the opposite day of the year from?
I'll conclude with the ^HUI chart of the MOEX. Huh? What?
I'll repeat as I always do...
Think it through. Seriously...
Think it through. Always study. Never give up.
See you on the flipside...
The CoinGuy
"On the XOI, are you looking at the weekly 9/18/2006-7/7/2008 and comparing it to the weekly 4/19/2021-today?"
Here is a weekly chart of the ^XOI.
Remember...both Doc and I have mentioned. Pattern's do not repeat...they rhyme. Why is that? It's because of the nature of patterns. No matter whether you're fulfilling a short term pattern on the daily...or you're zooming out and looking at the monthly. You're ALWAYS inside of a 'pattern...within a pattern' and the fractal always abides by the structure of the larger formation.
Can you begin to see it? To understand it?
In the ^XOI...If you're taking the rules of the larger formation into consideration...the 2020 lows are the MAGNET.
Now...let me take this one step further.
Perhaps...take what I've said and think ^GSPC?
WHY?
Put your thinking cap on!
If the decline in the ^GSPC is halted at 2,240 to 2,250(2020 MAGNET)...then you'll be setting up for one type of decline...and IF it barrels on through the MAGNET? Then...the end result is a 'numeric' structure that will resemble what I have just shown you in Natural Gas and ETH.
Think about that?
TCG
WTF...
As I posited on my post-it note. They're all broke and I mean ALL. Just as in '08...these collapses are only the pus oozing from those lurking in the "shadow's". Right here on my little tablet...I have a dozen "regionals" teetering on the edge right now. Although...as I look down...Pacwest is one of them. One(or two) money 'C'enter isn't looking too healthy either. Probably why I put up charts of both?
I don't think you'll mind?
When I got in this afternoon....I received your note. I hope you don't mind if I reply in public because I want everyone to benefit from the question you asked.
Which is...where is Henry Hub Natural Gas headed?
Would it be helpful if I just give you the answer in a picture?
Or...maybe I'll add a few words.
I mentioned over the last several months that the tech stocks(and crypto) were winding their way through 4th wave consolidation patterns while the broad markets were completing their topping pattern and setting up for their crash phase. Also known as...a 3rd wave decline.
Now. The reason I've taken a break is because you're not going to convince anyone of anything after they've taken a position...and your...time is up. So...this canary simply stopped singing. At this point, the best advice I can offer...is to clean up the trades you're wrong on quickly and simply...reverse course.
Going forward...
I'd imagine...if you're traveling with vehicles that would benefit from being short the broad markets...this would be your best vehicle at this time. Shorting the metals(with something like GDXD) or any of the sectors where you're traveling in a fifth wave...can turn around and bite you real quick. These are notorious for sharp rallies...and then folding over and resuming the decline with you sitting on the sidelines licking your wounds. Unless you know what you're doing...again...those issues traveling with the broad markets...are your best/safest vehicle.
You know...I harped on about ^XOI for quite some time and no one seemed to care. That index is in it deep. Stay away from anything associated with these sectors - for now.
Later on...when you're looking for bottoms. Just remember what I said. "Markets that run into trouble at 9.20 usually correct to one of three levels(with one variation). 1.30, .9, and .4(sometimes .45). Although, there is one variation...and that targets 1.00(+.10).
I'm going to make this very clear here. The broad markets at this time...like shooting fish in a barrel. Concentrate your efforts...there. Below 3810 is your confirmation...
In closing...take a good look at the chart. It IS the roadmap for the S&P 500. Just pull up a weekly and draw a line across 4,600....and start to think.
All. Markets. Are. Connected.
Best of Luck to All...
The CoinGuy
I have a lot of respect for everyone on this board. At the end of the day, Wall Street, politicians, and the powers to be, want us argue amongst ourselves so they can pick our pockets. Each day we all see and try to point out the manipulation, self serving ,rule bending, insider trading, bailout providing, etc, etc. I think that is part of what has made this board special. Hate to see the actions of others not part of this board, end up tearing this board apart.
I'm not personally familiar with the squalor into which NYC fell in the 1970s & 80s. But the city became notorious for crime & murder.
On a related note, in 1993 residents voted in the first Republican as Mayor more or less since WWII.
https://en.wikipedia.org/wiki/List_of_mayors_of_New_York_City
Conceding for argument's sake that all the policy goals pursued in San Francisco are noble & pure, it seems apparent on my aperiodic visits that the execution of that policy has been, to put it generously... "spotty." In some ways, the situation is not as bad as it is caricatured by rightwing media, which otherwise loves demonizing the place; but it is also far worse than those running the city and their starry-eyed supporters will admit. Quality of life there is down. I've walked my younger son past junkies shooting up on our way back from his doctor's appointment far afield from the Tenderloin or downtown. I've walked down long BART corridors at the Civic Center station lined with junkies, some cooking & others shooting.
For its part, San Francisco established itself as a safe-zone on the eve of an opioid wave. I've watched youtube interviews of addicts from other parts of the country who moved to SF because they knew they could get their fix and not get hassled - acknowledging that if they shot up in public back home the way they can on Market Street, they'd go straight to prison. As a result....
https://www.beatiteap.com/san-francisco-drug-addicts-outnumber-students/
If you've ever known any addict of anything, you know solutions are not simple. Supply of affordable housing is another component that has rendered urban California less attractive. With recession looming, the situation seems poised to get worse before it gets better.
But I would say much like NYC in the 1970 & 80s: only the foolhardy bet against San Francisco. And if its denizens surprise the nation eventually by voting in a Republican mayor, I'd buy up all the possible real estate I could manage.
We had NFT‘s, we had SPAC‘s, we have cryoto, all a sign of absolute and total mania and misallocation of capital in epic proportions.
Given all that stocks in general should be down much more.
Bitcoin supply is designed to be capped at 21 million.
This finite-supply imposes a scarcity that affords it great intrinsic value that many don't recognize.
One should be buying bitcoin today because of that.
Someday, Giant Meteor will slam into the planet, destroying human civilization in its entirety.
Such eventuality imposes a finite-supply on equities that afford great intrinsic value that many don't recognize.
One should be buying equities today because of that.
Where did everybody go?
APOLLO: “Data from downtowns show that cellphone activity in San Francisco is at 31% of pre-pandemic levels. New York is at 74% Chicago is at 50% Boston is at 54% .. … This has implications for retail, restaurants, and office.” [Slok]
CRE is in a death spiral. Just wait for leveraged loans!
Doc...
The 600 - 1200 oscillation...
I addressed this thought a long time ago. As I mentioned then...all you have to do is make new highs and these three charts become worthless.
10x - rest - 10x to completion. Just as in '29, no further market advances until all excess has been drained from the system...then, a New Deal will be proposed. This time...a New World Order.
I'll stand by this until its proven incorrect.
I have zero doubt...that I will not be held to account.
Boy...that anniversary of the October 13th low is coming around quick. Time. Flies.
Best,
TCG
I wouldn't want to speculate on something like that. I still think that money moves markets. Anticipation doesn't. At least not for long.
I think that reinstituting a reserve requirement would be so cataclysmic that it would never even be discussed. They would have to limit sweep accounts, and institute a reserve requirement on savings accounts. Furthermore, it would be a one shot deal. Once it's instituted, that's it. Unless they keep raising it. The Fed doesn't like draconian measures. It likes gradualism.
Another thought is that QT is an ongoing process of constant pressure. So they can reduce that, but what would happen with zero QT and zero QE? It would be totally up to market participants. Just like now.
Only a return to QE would retilt the playing field to bullish.
Another $22 billion withdrawn from the Fed's RRP slush fund today. Since May 22, down $557 billion. Furthermore, that's money being converted from "not collateral" to perfect collateral. And there's still $1.7 trillion left.
I was on the train from Warsaw to Malbork yesterday. Malbork is as quiet as Warsaw is noisy. In other words, really, really quiet. Just what the doctor ordered after 11 days of not sleeping thanks to the insane noise levels in one of Europe's most crowded, overdeveloped, and certainly most car crazy cities. I mean, Barcelona is noisy, but Warsaw is, I think, noisier in more places.
Meanwhile, bears finally made some noise on the Street yesterday. I had demarcated 4170 as the place where I expected sport to show up, but it didn't. They broke it, and today might feel like it's set up for more. BUT, as I've been pointing out, today is the idealized 5 day cycle low. And we've been teased before, not to mention tased before.
So we'll see. As of 3:20 AM NY time, the ES, 24 hour futures are near a 5 day cycle projection of 4135. But a nice little top pattern has also broken down. It has a measured move target of 4075-80. There are multiple sport lines in the 4110 area. Given the likelihood of a 5 day cycle low in the early going today. I'd be on the lookout for a turn somewhere around there.
They just edged below an earlier low set yesterday. There are no positive divergences on the hourly oscillators yet, but they are buried at levels where the last couple of minor lows formed. So maybe we get a lower low here, but I'd expect a rally later.
For moron the markets, see:
Non Functional GPS Market May 22, 2023
Swing Trade Chart Picks – Let’s Get Ready to Rumble May 18, 2023
Gold’s Immaculate Correction May 19, 2023
The Most Widely Forecast Economic Disaster In History May 16, 2023
Weak Real Time Withholding Taxes Set Up a Showdown May 4, 2023
The Big One is Coming May 3, 2023
Enjoy the Market Mirage Now Because We’re Really In a Desert April 24, 2023
The Fed’s Circle Jerk, is ‘Twerking? April 18, 2023
If you are a new visitor to the Stool, please register and join in! To post your observations and charts, and snide, but good-natured, comments, click here to register. Be sure to respond to the confirmation email which is sent instantly. If not in your inbox, check your spam folder.
If you're serious about the underlying forces of supply and demand that drive the markets, join me!
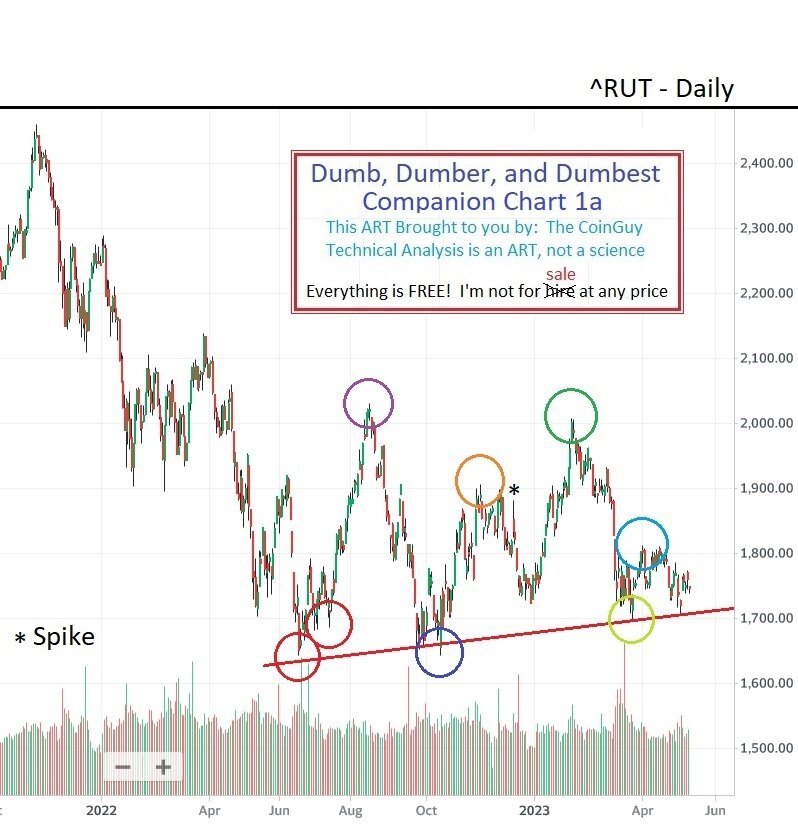
My "Dumb, Dumber, and Dumbest" Chart was posted early this morning, so it will be in yesterday's thread. Here is the first Companion Chart in the series.
The Russell 2000 is barely holding support...while the Nasdaq is attempting a push through resistance.
Interesting.
TCG
oh...and...
Patience Pays
Maybe if I post a variation of this pattern you can understand why even TCG would never front run the above setup. I always wait for a break on volume(and confirmation).
While the pattern eventually works in your favor...if you front run...you get treated to a nice punch in the face first. Having spent time in the ring...I prefer the patient approach to a busted nose.
As I exit stage left I'm going to drop this...
I added key short term support levels in the SPX and the metals. I sense a change in the latter, be on your toes. Also had to revise the XOI for the 3rd time! I looked over that chart good...if you slice through 1600, then I do believe 1400 will hold for a time.
Best of luck to everyone...I'll see you sometime down the road.
The CoinGuy
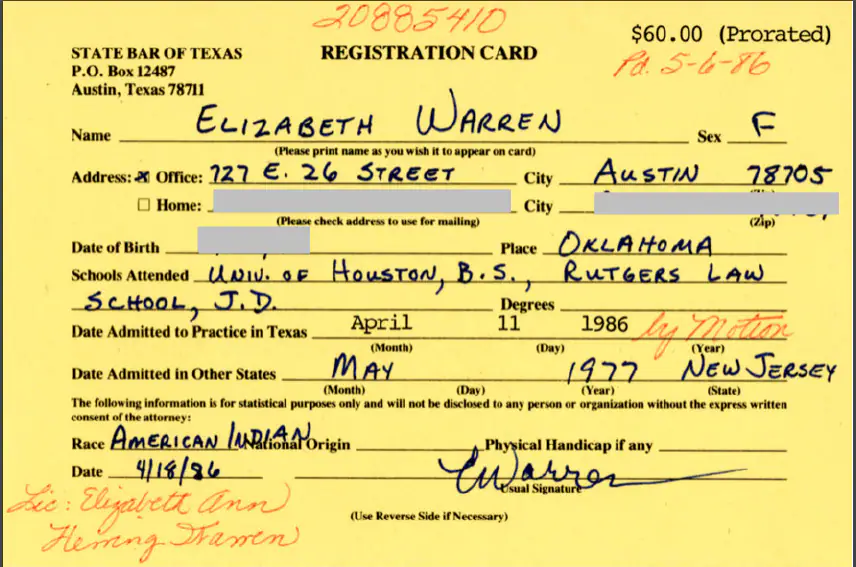
I believe this remains the earliest document on which Warren attested with her signature to being "American Indian." It dates to 1986.
My mom said she believed my uncle/her brother's physical appearance suggested our family had Native American ancestry. As the ca. 2012 article from which I took the document above (and the link for which I provide below) observes...
No. They are not. As I know from my own.
A year before Warren wrote that her race was "American Indian" on the document above, I heard word of a high school classmate who was said to have checked "American Indian" on her college applications. It was done cynically, and instead of attending Berkeley, she attended Columbia. I can't assert cause & effect between the alleged checked box and her educational options. Back when Warren's representations began, and when my classmate allegedly did what she did, this claim certainly conferred Affirmative Action program advantage.
https://www.washingtonpost.com/blogs/fact-checker/post/everything-you-need-to-know-about-the-controversy-over-elizabeth-warrens-claimed-native-american-heritage/2012/09/27/d0b7f568-08a5-11e2-a10c-fa5a255a9258_blog.html
Ten years is a long time to have yourself listed as "Minority" in a Directory of Faculty. There is plenty of deniability on Warren's part, and it is misfortunate that the public figure who made greatest political hay about this all is a detestable fraudster from Queens.
But I don't care what deniability she might successfully bring to the table. I followed her story closely, because the basis of her claim seemed as flimsy & familiar as one I might have made at a time when I and others understood it to confer advantage.
So... if I call Warren "a liar," I'm comfortable with the charge. Does any of that detract from notable stuff she did, some alluded to in the article? Not in any way - I remember watching her on CSPAN after the GFC and before she entered politics and being extremely impressed. I knew who she was before she ran for Senate.
But I'll go further: I think she was a self-serving cynical fucking liar when she made her claim... which isn't that big a surprise, since she ended up being a politician, and "self-serving cynical fucking liar" is sort of a prerequisite.
For men & women alike.
Saw an interview or read something at some point in the past 12 months about an outfit repositioning an SF office building for condos. It was really interesting to learn how completely insanely complicated the project was. I remember elevators being one issue: locationally, you might put them somewhere different in the core for an office floor than a condo floor. Then there was utilities - electrical & plumbing has to be run fresh in ways never previously contemplated. Then there's fire escapes: an office may devote one side of the building for escape, but that doesn't necessarily work for a condo if the resulting escapes are behind someone's locked door. It was very eye-opening.