|
Archives 12/30/01, 1/1/02, 1/2/02, 1/3/02, 1/4/02, 1/7/02, 1/8/02, 1/09/02, 1/10/02, 1/11/02, 1/14/02, 1/15/02, 1/16/02, 1/17/02, 1/18/02, 1/22/02, 1/23/02, 1/24/02, 1/25/02, 1/28/02, 1/29/02, 1/30/02, 1/31/02, 2/1/02, 2/4/02, 2/5/02, 2/06/02, 2/7/02, 2/9/02, 2/11/02, 2/12/02, 2/13/02, 2/14/02, 2/16/02, 2/19/02, 2/20/02, 2/21/02, 2/23/02, 2/25/02, 2/26/02, 2/27/02, 2/28/02, 3/1/02, 3/04/02, 3/05/02, 3/06/02, 3/7/02, 3/10/02,3/11/02, 3/12/02, 3/13/02, 3/14/02, 3/15/02, 3/18/02, 3/19/02, 3/20/02, 3/21/02, 3/22/02, 3/25/02, 3/26/02, 3/28/02, 3/30/02 4/1/02, 4/2/02, 4/3/02, 4/4/02, 4/6/02, 4/8/02, 4/9/02, 4/10/02, 4/11/02, 4/13/02, 4/15/02, 4/16/02, 4/17/02, 4/18/02, 4/20/02, 4/22/02, 4/23/02,4/24/02,4/25/02, 4/26/02, 4/27/02, 4/29/02, 4/30/02 5/01/02, 5/2/02, 5/4/02, 5/6/02, 5/07/02, 5/8/02, 5/09/02, 5/10/02, 5/13/02, 5/14/02, 5/15/02, 5/16/02, 5/17/02, 5/20/02, 5/21/02, 5/22/02, 5/23/02, 5/24/02, 5/28/02, 5/29/02, 5/30/02 6/01/02, 6/3/02, 6/4/02, 6/5/02, 6/6/02, 6/7/02, 6/10/02, 6/11/02, 6/12/02, 6/13/02, 6/14/02, 6/17/02, 6/18/02, 6/19/02, 6/20/02, 6/22/02, 6/24/02, 6/25/02, 6/26/02, 6/27/02, 6/30/02 7/1/02, 7/4/02, 7/5/02, 7/11/02, 7/14/02, 7/15/02, 7/16/02, 7/17/02, 7/18/02, 7/19/02, 7/22/02, 7/23/02, 7/24/02, 7/25/02, 7/27/02
|
The Anals of Stock ProctologyPublished weeknights by
8:30PM Happy Acres, Florida Time The American Academy of Stock Proctology and Is your subscription up for renewal? If you want to renew, do nothing, unless your credit card has expired. Please be sure your credit card info is current. If your credit card has expired, you must enter the new expiration date in your Paypal account in order for your subscription to be processed. If you subscribed via Paypal, your subscription will be renewed for one year on the 90 day anniversary of your sign-up and your credit card will be charged. If you want to cancel, use the button at the bottom of the page. This applies only if you subscribed through Paypal. Mailed-in subscriptions are for 1 year. If you subscribed by prior contribution, I will send you a notice before your subscription expires. If you have any questions, see the subscription page and FAQ's. If you can't find the answer, email me. Going for the Gold (7/29/02) OK, let's get the business of Doc's opinion out of the way immediately. Given the degree of panic, the parabolic nature of the move, the extreme flip flop of the sentiment indicators from panic stricken on the downside to panic stricken on the upside overnight, and the lack of even a minimal pullback, to a grizzly old stock proctologist, this smells like a terminal blowout. That said, Doc would still not short it. Once the meltup is over there will be plenty of time to get short. Capital preservation remains the watchword. So what if you miss the exact high! Your stock proctologist reminds you, this ain't about being a hero. It's about keeping your money, number 1, and making some number two." Uhhh... right. Looking at the cycle picture, there are more questions than answers. Most indicators have confirmed the upturn. Some haven't. Doc remains long term bearish, so he isn't looking for buying opportunities. For all you bears near and dear to Doc's heart, the important thing is to keep your powder dry and be patient. Don't try to pick the top of this thing unless you have strict parameters for knowing when to get out, (i.e. tight stops) and keep plenty of cash in reserve. When it's time to get short in a big way, it's going to be very clear. Don't jump just because the rally looks insane to you, and because you want to prove bulls to be idiots. This is a historic short squeeze and derivatives melt-up. Wait it out. It could be days, weeks, or even a couple of months. Tops, even short term tops, are not built in a day. During this time I'll take more of a look at the gold stock index as an alternative vehicle, and will post it in the evening. Guess what boys and girls! Cousin HUI gained over 7% today, outperforming the broader market. The chart is at the bottom of the page. When you look at it, ask yourself whether you'd rather be buying that or the Sphincters Index. The Feed took no action again today. There were no expirations. There are none tomorrow. The total Feed, which is the amount Fed holdings of loans and securities, remains at the lower 10% growth channel band. If there's no change in policy they would begin pumping again this week. However, the bond market sold off big Monday and there's ample reason to believe that a significant low is in, in bond yields. A break below the channel will signal a policy shift toward slower monetary growth, in an effort to support lower inflation. And heaven forbid, Al may not want the market to blow another bubble. Don't be shocked if he takes his foot off the gas. In theory, any tightening of the
Feed growth rate
would be devastating for stock prices in a financial system starved for
liquidity. We shall see. This week is going to be extremely interesting.
As stoolie Goldmember pointed out, there's another huge Treasury auction
this week. What's that sucking sound I hear? The Feedometer, which
theoretically measures the amount of excess Feed available to the Gang of
22 for jamming stock prices, (although not necessarily always used for that
purpose), has turned DOWN! This is another sign that Al has taken his
lead foot off the gas. However, as you recall from last Thursday's
Anals, there's yet another GSE credit bulge in the pipeline that will come
on stream very rapidly in the weeks ahead. It will be interesting to
see if a financial system on the brink of collapse can reflatulate itself and launch
yet another mini-boom like the one in the fourth and first quarters.
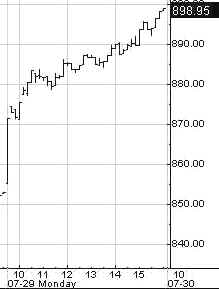
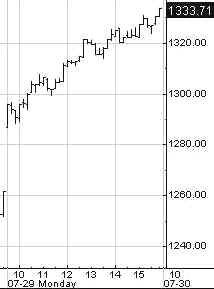
Portfolio Sphincters Index (SPX) and Sentiment While key swing trading cycles have turned up, the 6 month cycle is still uncertain. It's too early for confirmation on that. And it's still too early to tell whether the rally will have legs. At this point the 4 week cycle is the longest cycle with enough data behind it to suggest a centered moving average projection, with a broad cmap range of 900-950. There are apparently no more than 4 days left in that cycle. But that only matters if the 6 month cycle isn't finished bottoming. If it has turned up, this rally will keep right on going. Doc wouldn't think of shorting until there's some clarity on that. The 17 day rate of change, which represents the 6-7 week cycle, zoomed upward, reflecting the powerful thrust. Even if this thing suddenly poops out, and we don't know whether it will or not, there would still be enough residual upside momentum to build a top lasting at least a week. The superimposed 6-7 week cycle oscillator (red) and the 10-13 week oscillator have also turned. This could last a while, folks, if not going straight up, at least churning through and around along the top of long term downtrend channels. There's going to be a battle royal up here at the least. The 29 day rate of change is lagging in terms of flashing a buy signal. Doc isn't drawing a lot of solace from that since we've already had a massive move, but it does cast doubt on the quality of the move. The market usually does some backing and filling during the trough phase of the 10-13 week cycle. Then it takes off to the upside when the indicators get in gear. This time we didn't have that luxury. Now that we know the rally wasn't exactly constrained in price terms, the final question is whether it will be constrained in terms of time. If it dies quickly, say no more than 2-3 more days, without disturbing the downtrend channels, the one year cycle down phase is still in force. There's no point in speculating beyond that thought. The VIX fell to 33.73 after hitting 56.74 last Wednesday. That's an extraordinary move. The index has hit the top of the descending Stool Band projection. The issue now is whether there's an immediate reversal. If not, the channel will begin to turn up. Fear is receding rapidly. That is cause to remain suspicious about the sustainability of the rally.
The blue channel lines are the extension of a linear
regression channel from the September 2000 and March 2002 highs. The 6 month cycle oscillator and the trading stoolicator are still trending down. This might be one for Ripleys. They are obviously confused. Or right. Which is it? The short cycle oscillator is headed up rapidly and at a steep angle. That, like the 17 day R.O.C., signals that there will at least be some residual upside mo that will need time to reverse. The 10-13 week cycle oscillator now
has a confirmed upturn. The cycle counts say the top could be anywhere
from today to 3 weeks from now. The next fiber nacho reflux
level is 902, then 912. The Cycle Conditions tables include cycle phase and a wild guess as to number of periods to the next turn, in days for the shortest cycles, weeks (W) or months (M) for the longer ones. This is a fluid exercise, in other words, the projections are likely to be wrong, but they force us to be vigilant for key turning points, and frequently work well enough to prevent costly misreadings. SPX Cycle Conditions as of 7/29/02
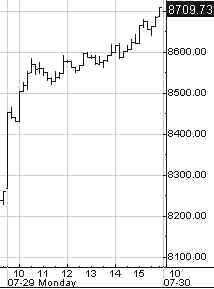
PTT - Periods Till Turn Nasgap Charts Cmaps for shorter trading cycles now point to as much as 1400. The upside cmap on the 8-13 day cycle popped to 1325-75. The 5-6 month cycle cmap still hasn't given up on a possible shot down to 1050-1150. That will go away if the market stays at these levels for a few days. The
10-13 week cycle oscillator is forming a bowl, still in negative territory.
Unless it turns higher, this rally isn't going very far. The Nas
closed at the 38.2% fiber nacho reflux level of the last selloff. Next
level up at 1342 is not a big deal. Beyond that 1370-80 should be more
formidable. Nasdaq Cycle Conditions as of 7/29/02
PTT
- Periods Till Turn AM Edition Features (Previous) These features are in morning edition, published around 9 AM ET US, or the Saturday Weak End Edition, published, uh, let's see, Saturday! Bond yields look like stock prices. The rationale for a 10-12 month cycle low is strong. The question is, since stock prices have moved in lockstep with bond yields, then shouldn't we conclude teh same for stock prices with regard to the 10-12 month cycle?
Henceforth and forevermore, if you would like to request a "stock o'der", please post your request in Dear Dr. Stool. If you have not already registered for the message board, please do so. The only required info is user name and password which you choose yourself, and your email address, which you can keep private by selecting the keep private option. Doc looks forward to featuring your ideas. We've had some good ones! Uncle Buck's Illness
Uncle Buck may have jumped out of bed so fast, he just banged his head on
the ceiling. This is close to a short term cycle high that should be the precursor
to a trading range lasting 2-3 months. Uncle Buck and the stock market
should continue to track together. Golden Stool Cousin Hui
finally made a stand at the lower long term channel band. The 10-13 week
cycle cmap was around 90. They got close. The cycle indicators haven't
turned up yet. There's more work to be done around this level before a
lasting upturn but all the indicators are in the right place. So long as the
10-12 month cycle indicator holds around the zero line there's no
problem. See you in Intraday Stool. Dr. Stepan N. Stool Share your thoughts on the Stool Pigeons Wire.
Renewals Welcome, and thank you for subscribing to the Anals of Stock Proctology. Your trial subscription will run for 90 days. At the end of that period your subscription will renew automatically, unless you cancel. If you wish to cancel your subscription use the button below. If you want to renew your subscription do nothing. Your subscription will renew and your credit card or Paypal bank account will be charged. If you want to renew, be sure your credit card information in your Paypal account is current. Paypal will not renew your subscription if the card has expired! Again, thanks for subscribing!
Explanation of Intraday Commentary-Build charts at http://www.livecharts.com. For custom time bars insert a comma after symbol and number of minutes, e.g. compx,90. This will give you a bar chart of the Nas with 90 minutes per bar. The one day cycle is usually most clear with 8 minute bars and 26/18 stochastics. It varies from day to day. Sometimes 6 minutes works best. Experiment to find the best fit for your trading style, and the market's dominant frequency at the time. The goal here is primarily to monitor the condition of the 8 and 13 day cycles. I typically use 90 minute bars with 26/18 stochastics for the 13 day cycle proxy on the indices during regular trading hours. Other cycles use 26/18 stochastics with the following: 8 days- 60 minute bars On the 24 hour futures charts, use a time per bar approximately 3 to 4 times the above number of minutes, to represent the cycles listed above. ABBREVIATIONS: cma: centered moving average |

 Any doubt about whether the bottom was confirmed was erased early in the
day. Now the questions are how high, and how long. The size of the move in
four days is virtually unprecedented with the exception of the last rally
in the 1929-1932 bear market, which was brought to our attention by
stoolie TGakaTheBig Hurt. The February 1932 rally preceded the final
plunge in the Dow from 88 to 44 in June, then 40 in July.
Any doubt about whether the bottom was confirmed was erased early in the
day. Now the questions are how high, and how long. The size of the move in
four days is virtually unprecedented with the exception of the last rally
in the 1929-1932 bear market, which was brought to our attention by
stoolie TGakaTheBig Hurt. The February 1932 rally preceded the final
plunge in the Dow from 88 to 44 in June, then 40 in July. 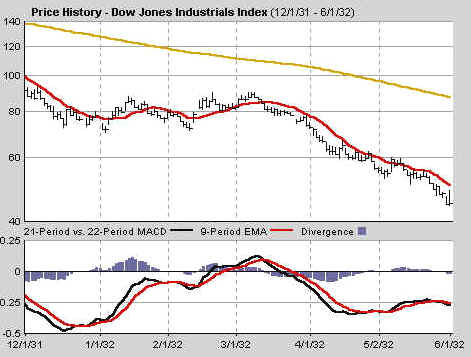
![[Most Recent XAU from www.kitco.com]](http://www.weblinks247.com/indexes/idx24_nasdaq_en_2.gif)
![[Most Recent XAU from www.kitco.com]](http://www.weblinks247.com/indexes/idx24_sp500_en_2.gif)
![[Most Recent Quotes from www.kitco.com]](http://kitconet.com/charts/metals/gold/t24_au_en_usoz_2.gif)