The whole world is perfectly aligned for Russia! Russia! Russia!
FTW...
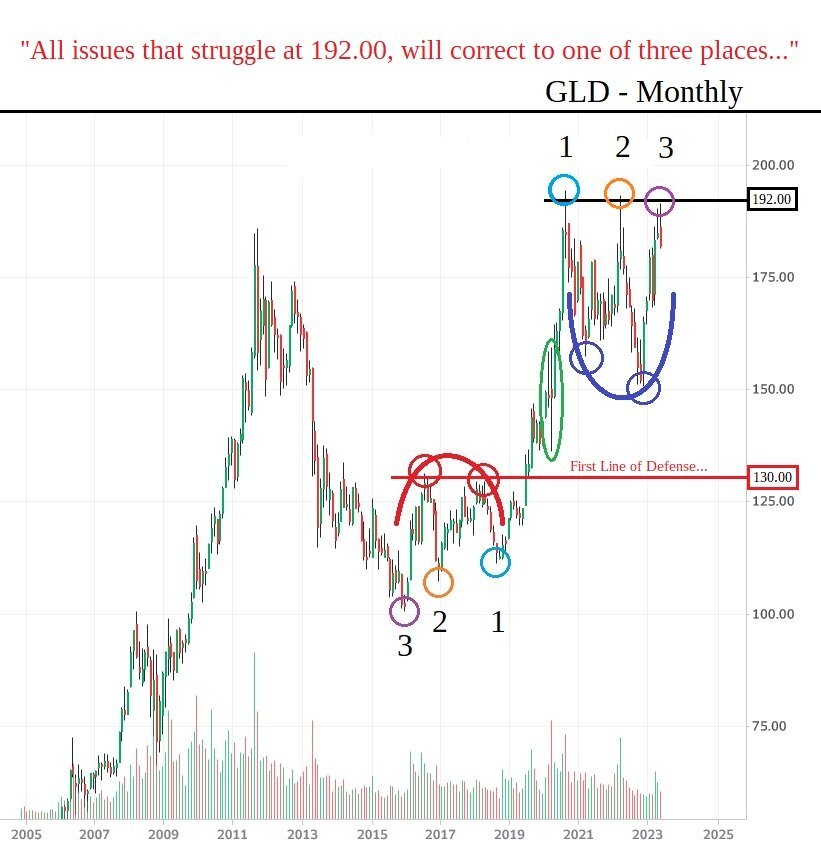
Going forward. Please remember/recall the two themes. "All issues that stumble at 192" and "So. About Half?"
Don't think for a second that I forgot...
I owe you a Gold Star chart.
Don't be turned off by the rough appearance...there is a gem inside. This IS the most potent chart I have publicly posted.
The consolidation "in the ^DJI" from January 26, 2018 to the peak on February 12, 2020(747d) right before the pandemic crash is the left...and...from the January 5th, 2022 peak until this very day(555d)....is the right side. Understanding wave pattern distortion(and you should have at least a basic comprehension by now), you might begin to SEE they are nothing more than a mirror image of one another.
Subtract right from left?
Speaking of mirror images. In my last post entitled..."Real Answers to Real Questions".
June 16 - June 30 - July 14.
"As you enter into the formation...in the same manner you shall leave."
This CAN apply to time as well...
Bear Instruction Manual 5.0
I did look over the BIM 5.0, no changes are necessary. All numbers are good, but I will comment that SLV/GLD are in the throes of a crash...avoid this area at all costs. With the SPX, I've already mentioned it many times. Wait until 4460, then 4410 is given up on volume.
In ALL Things...Patience.
TCG
Think this through. Study. Never Give Up!
I'll drop in at 2,240 to 2,250 on the SPX.
Oh...and...
Would this clear up the question everyone is afraid to ask?
2.24 + 2.24 = 5.18
See you then.
FTW...
This should clear up any misunderstanding of that secondary pocket? This quick & dirty chart is just a recap from "So...About Half?". Your particular issue is slightly distorted, but that changes nothing on the downside.
TCG/TTM
FTW...
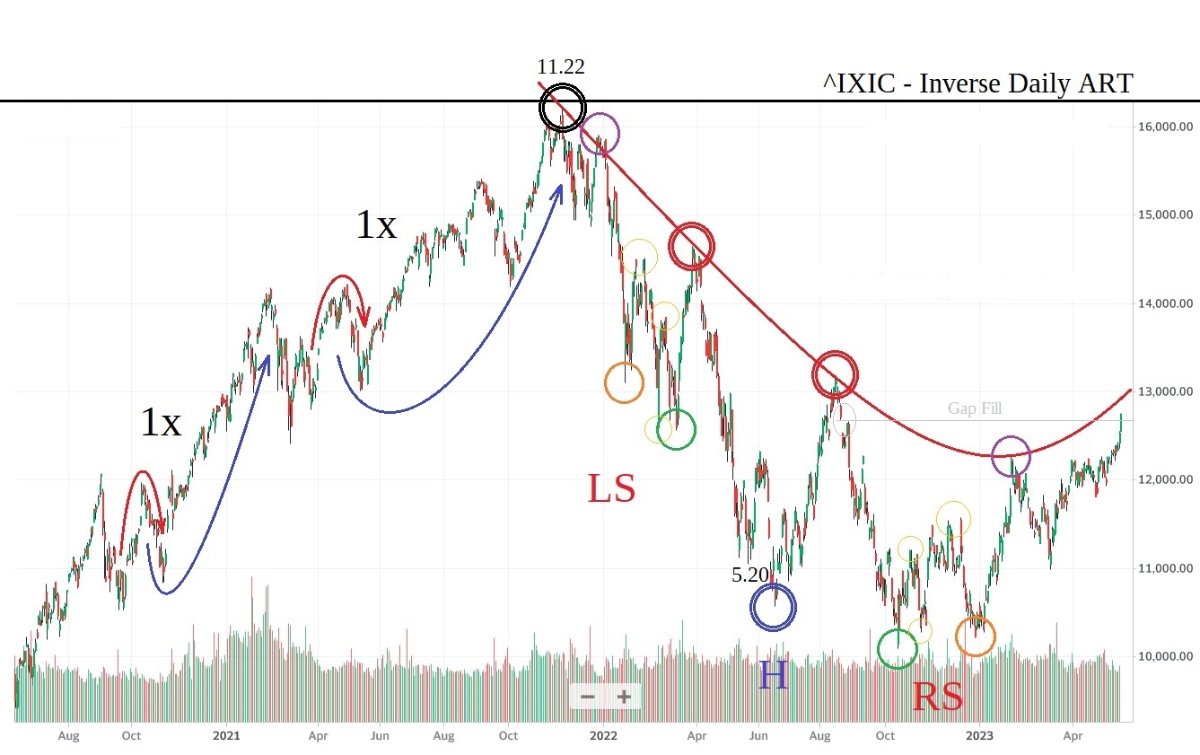
Here is a chart to accompany that encyclopedia of an answer. I inverted the 8.16 peak so you can see the current S&P 500 in its proper form.
To answer your real question with a real answer.
I expected the first primary peak to be on the 16th as mentioned on that day. Then, if there is to be a follow-up retest...the 30th of June which is this Friday is the best candidate. Could come in late, even up to a week...but I don't see it yet. Suffice it so say...anywhere from 14-21 days is open game.
I also don't believe a secondary peak/retest will be strong enough to bring all issues to a new high, but could do so for the ^IXIC and the ^GSPC. The ^DJI, from my perspective isn't guaranteed.
At any rate...the retest(for most issues) should be...'the high'.
I already gave you the target price, which was 4400(+10/-10) and I'm now very comfortable that you understand what I'm saying...and why I'm saying it.
I also told you that outside of the 50 point envelope is 4,510. If my target was off, 4460 should contain the probe...but...above 4,510 on volume the market will look to make a new high surpassing the 1.04.22 peak.
I don't see that happening...
At this moment...I've looked over my work...and I see no reason to change my forecast.
While I am here...
There was a minor typo in the DJI section of BIM 5.0 - Final Public Edition, it has now been corrected.
Best,
TCG/TTM
oh...and...
If you need examples of double peaks. Please recall the market I told you would turn first?
The metals.
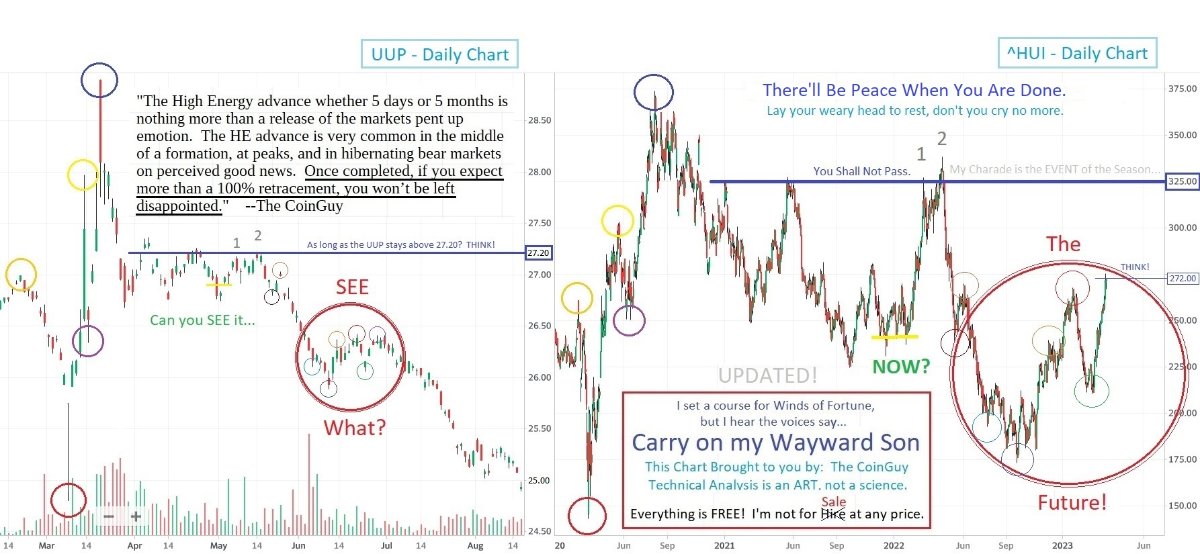
Look at the ^HUI, the GLD and the SLV. Should be pretty clear...
Then, Perhaps...
Take a look at AMD.
There's you canary. Tweet. Tweet.
I wholeheartedly agree(and endorse) this statement for the broad market issues.
I personally hold the "A.I. Narrative" issues to a completely different standard.
Best Regards,
TTM
Good Afternoon…
Here is a copy of my ‘Bear Instruction Manual – 5.0, the Final Public Edition.
Going forward, the manual will be posted on my new site. As with all things, it will always be free. The site will be centered around teaching of a new method of Technical Analysis I call ‘Patterned Behavioral Analysis’. Of which, you’ve already received a taste. The site by its very nature will be centered around education.
The new site will be at thetwistedmystic.com and is just about ready to go into development. Nothing fancy, just a simple blog where charts(and mild commentary) will be posted. Nothing more...other than perhaps a pattern chart archive as a later addition. I’ve spoken with Tom...I’m thinking mid to late August for a completion date sounds about right.
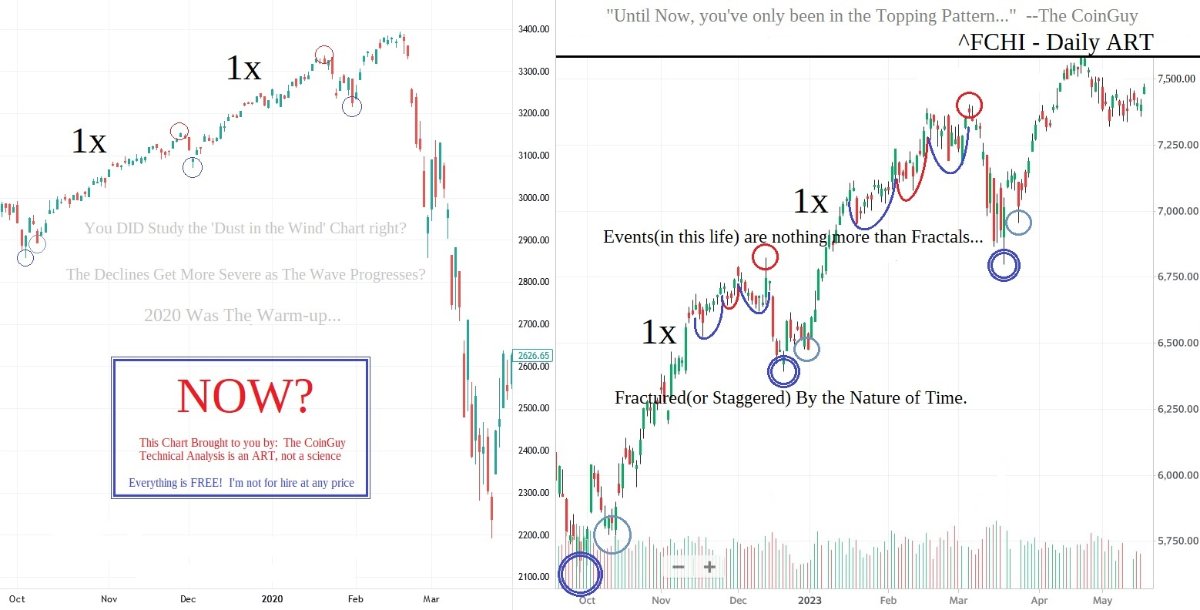
My whole theme for this decline that we’re on the edge of is taken from the title to one of my charts…
So...About Half?
I’d imagine that chart is somewhere in the archive on this site. Although, here is a more current rendition along the same theme.
I do believe as we go forward...you’ll see this theme played out across all markets. Please keep your eyes on the MAGNET of your particular issue of interest...and if you’ve followed me, you know why.
Here is my recent companion chart to “The Great Unwind” chart series:
I can't say enough...that this chart series should be studied until the concept that is represented within the chart is completely understood. From my perspective...your financial life depends on it. The rest of the charts in the series are in the archives. They ARE a complete package. If you only studied these charts over the next 36 months...and Fine Art. You need nothing else.
And lastly. Just as we started the 2022 decline in the spring with my “Canary in the Coal Mine” chart...I think now might be an appropriate time to revisit this issue and expand on a few 'thoughts' I've mentioned previously.
I have many more, but really none of them matter all that much until confirmation is given and from my perspective, confirmation is lacking. Hell. Most people believe, probably even most of you...that we're in a new Bull Market.
I do not agree with that assessment. I believe...market pundits are pushing a narrative...hoping it will stick. It will not...is my call.
I recently called a high on the 16th, but...I feel confirmation is lacking despite having reached the middle of my technical numbers for the peak in the SPX(4410(+50/-50))I personally didn’t feel right about it. I still don’t. I’d like to see a retest, I’d really like to see the high taken out and then rejected. In fact...I’d love for the ^GSPC to nail 4,510.
Although, I don’t always get what I like.
Now...the reason for my hesitancy is this. I use a dating sequence in my timing of peaks and valleys...and the 16th either isn’t the high, or I don’t understand the numbers yet. To be forthright...and as you know...I’m not a fence sitter. I truly...am not 100% sure.
Most of the numbers look good. Many of the issues I’m following have finished up their respective ABC’s and I saw many intraday reversals during the latter part of the week. Some of the overseas markets have turned as well, BUT...despite seeing those reversals...I’m not seeing the required follow-thru as of yet. I need to get my eyes on a few more candles before I can call it good.
If things go wrong. They will do so at 4,510. Simply. Step. Aside.
You know me by now. I’m always suspicious at the turns and I’m only after the 80% in the middle…
Arrive to the party late...leave the party early. Clear your head. Rinse. Repeat. Long and Short.
Now. With that said...
As always.
“One day does not a new trend make.”
“I’ll judge today, by what I see tomorrow.”
“I’m from Missouri...Show Me.”
I’m going to add one more...
“In all things...Patience.”
For myself. Zero positioning will be sought until after we’re back under 4,310 on the SPX.
Although, some mild cherry picking at the peak in the ^IXIC...may or may not have occurred.
For those who do options. 12 to 15 months is the sweet spot.
Best Regards,
TTM
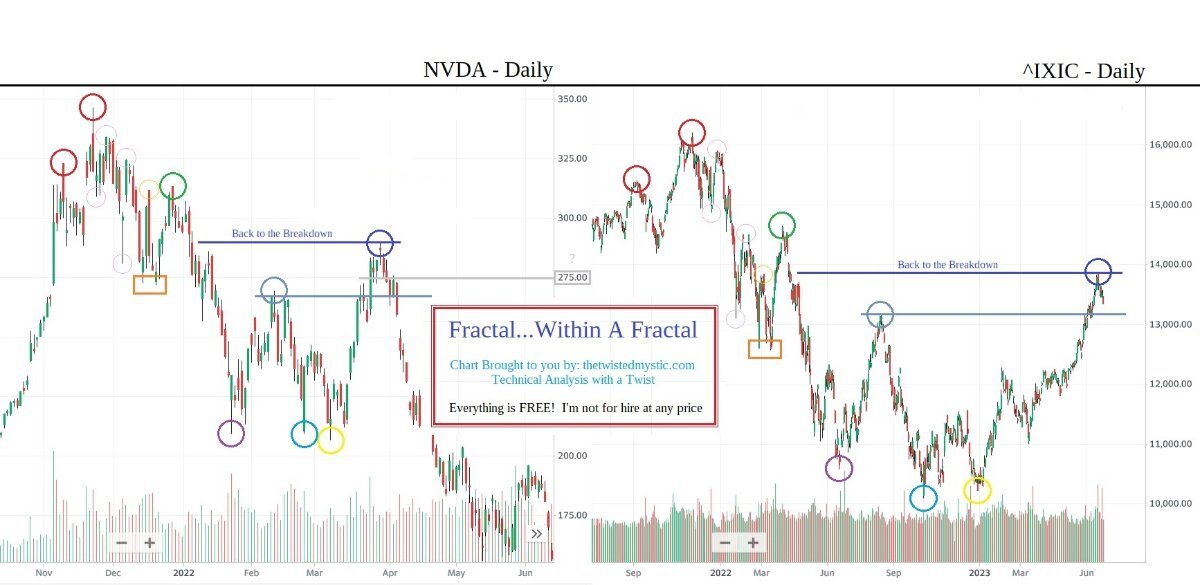
"FTW...from my perspective, I've done you a bit of a disservice answering your questions in the manner that I have, which is without illustrations. Therefore...you'll see a post on the thread soon."
From our discussion on the ^VIX...
I also reviewed the other questions we discussed...
I'll add two simple charts and follow it up with 'One Step Ahead'.
Quick comparison from the Tech Wreck in 2000 vs today in the ^DJI...
Then...stretching the triangle as we discussed. Trading range bound while within the pattern. What pattern? See next chart...
I'll ask. How many days from 11.04 to 6.16? As always...please remember. The MAGNET is only the first 'small' step. Like I've said...This isn't a one and done like 2008.
I've also said since day one...The tech stocks are "One Step Ahead" of the broad markets.
That's ARKK on the left...and the ^DJI on the right.
I'll have more when the TIME is right. I see zero reason to get ahead of the market, er, uh...the Fed.
In closing...
Recession? I planned for a 14 year Worldwide Depression. As far as I'm concerned...we're right on schedule.
Oh...yeah, I forgot. Happy Birthday Will's. You survived your 40th!
Now...only 13 years left.
The CoinGuy
oh...and...
STOP CHASING UNICORNS!
This give you any ideas?
The final push I discussed at 275 is just about complete. As promised...I'll join you in NVDS when you're back below 400. Target price for NVDA has not changed. 50 bucks...and change.
I noticed accuracy levels in your stock pickings have fallen off since I left PC&A's corral, mr. neighbor. If you keep playing in my playground...you're going to lose a few fingers.
It is all coming into view yet?
Good evening...
I had a larger post this morning, but I felt the message was muddled and didn't bring as much to the table as I intended.
Just too many distractions. Every time I tried to sit down and concentrate on something...I was interrupted.
"Long is strong"? I admire anyone who invests along the lines of their convictions. For me, the only arbiter of truth is the market itself.
Best,
The CoinGuy
oh...and...
I'm going to park this here...
Please ignore the T.L, N.L, T.H, N.H. in the chart...it is something I haven't had a chance to cover on this site.
"Never let a good crisis go to waste" is the first thing that comes to mind.
I'd imagine that a) It's already written, and b) It is full of goodies for the suits(and their friends) and c) Gives the shaft and a small check to the American people.
Essentially a repeat of '08.
Although. As I said further up in the thread and in my "Dust in the Wind" chart...I do believe that will be the misstep.
I'll just say this for now. I believe the "Full Faith and Credit" clause will be tested.
I also believe...it's all been planned.
A Digital Dystopian Central Banker's Wet Dream will be on the table...sooner, than later.
TCG
oh...and...
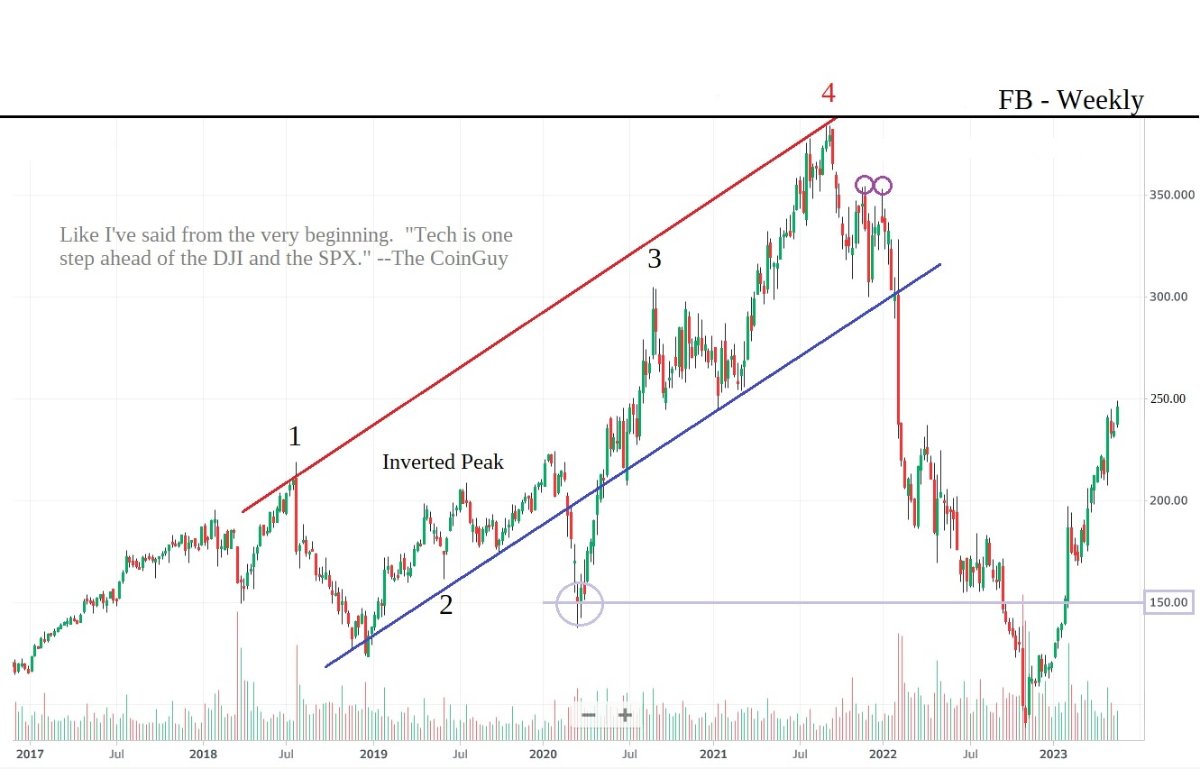
FTW, you know...I just remembered that you weren't around early last year when I spoke of PayPal and Netflix as excellent 'Canary in the Coal Mine' issues and how "Tech was one step ahead of the DJI and the SPX".
Here is a quick chart I made up of FB(Meta). If you compare it with..."Sixteen Times Twelve Is?" and "The Holy Grail" above...it should be able to give you ideas. Ideas that will light your path forward in the Stock Market.
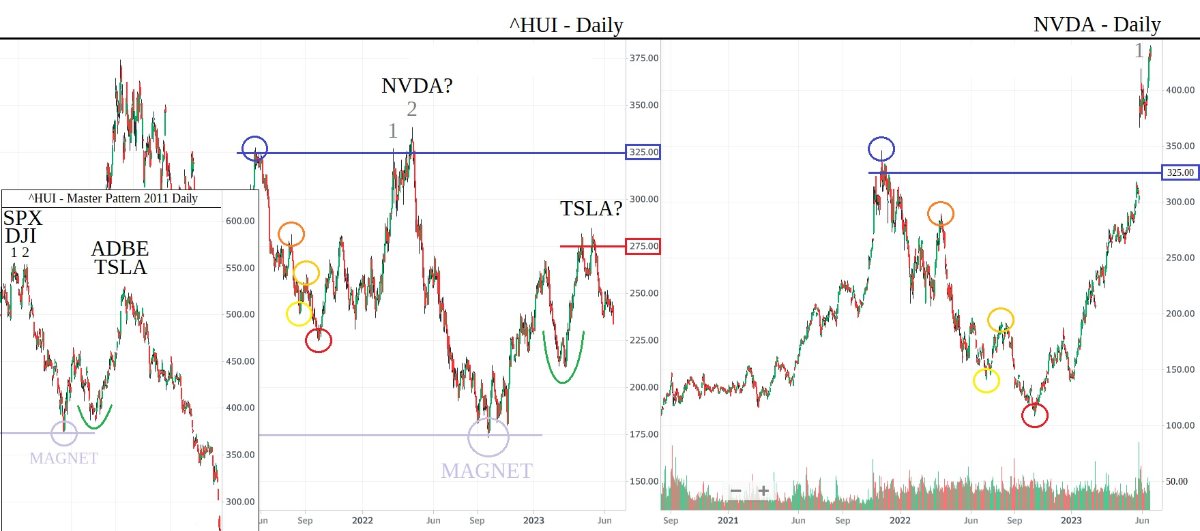
While it is not exactly the topic, nor the reason I'm posting this chart...I will mention...while NVDA is a momentum issue...it also cannot escape this pattern. On the weekly, peak number one is October 1, 2018.
Best of luck.
Ok. Now...THAT was the last chart. Smile...
Good evening...
For now...this is going to be my final chart.
The Holy Grail:
The rules for this formation can be read in the "The Great Reset UPDATED, Companion Chart 1a" below. In fact, for your convenience...I'll just post a copy of the whole series from the beginning.
Since early April, I've given wave after wave of charts. I think this is enough until 3810 is lost in the ^GSPC. Once 3810 falls, I plan on being less and less active until we reach the MAGNET.
I actually never planned on giving market commentary, smile. I'm a goldbug.
At the MAGNET is where I'll be assessing the gold(and silver) situation...and probably update this chart here. Although, none of what I say should come as a surprise...FTW's 'Gold Star' Chart...already light's the path to the Promise Land.
Remember what I said...If the magnet holds. I'll give one final series of charts.
Then...POOF! I'll be gone.
Where?
For me, it's not Blue Skies, but Blue Water...
If the magnet doesn't hold? Well...we'll come to that IF it happens. I'm not holding my breath.
At the magnet...when people begin to see 90% declines. Oh, they'll be calling it good when the suits step in to screw the public(for their own good).
Unfortunately...I'll still be shaking my head in disbelief.
Compounded leverage takes more than one stage to unwind.
Best Regards,
The CoinGuy
oh...and...
As promised...
The Great Reset ORIGINAL:
The Great Reset UPDATED:
The Great Reset UPDATED - Companion Chart 1a:
For those who would like to understand the thoughts behind this pattern. Just search the archives for: "The Pattern!", "The Pattern within the Pattern!", and "Through the Looking Glass". If you can't find one of them, just shoot me a private message and I'll re-post the missing chart.
In 'Through the Looking Glass'...I gave my exact thoughts on what I felt the next decade would entail - all within the confines of the 60 minute chart.
To me. That chart is a masterpiece.
One final chart as we head into the weekend.
It's not over. It hasn't even started yet...
Sixteen Times Twelve Is?:
Over a decade later and the ^HUI is still looking for a bottom...
Best Regards,
The CoinGuy
I leave for a couple of days and the Bulls have completely destroyed the China Shop...
It appears as though I'll be playing the part of the Bear this go around. Claws and all...
After all it's nice to have someone to point fingers at and chuckle...although, it does prevent some from turning inward and taking a good long look at their own behavior.
Of course....I'm not speaking to any of you fine gentlemen.
I see the 'move to dishearten the bears' has brought the 'emboldened' bulls out in force. Although, calling a sideways consolidation since the October lows...a bull market...is a bit of a stretch? We've been going sideways for what, almost a year now? No matter...I'll run with the idea.
If the ^GSPC can steamroll through 4310(and hold it), I'll be joining you on your quest.
I was actually inspired to see the Nasdaq clean out that gap...and since the ^GSPC is so close...I'd like to see it follow suit. Then...I consider this 'bull market', over. Now. If 4310 is pierced and can be held on Volume. I will gladly accept that I've been incorrect and pick up a spud peeler. I prefer the swiss peeler, Kuhn Rikon...and I have it at the ready.
Until then...let's see how it goes. I think the turn is coming in about right now, meaning today. Although, perhaps as soon as Monday? Although, it's never Mondays? Is it?
Here is the aforementioned gap in the SPX:
I'd like to see it fill...and then this market roll over like a good dog.
Twin Peaks Formation Reference Chart
Despite, what? A year of constant harping and 25-30 charts outlining the Twin Peaks Formation from every angle possible, not a single taker?
Ok...
Since I spent time completing the chart below, I'll post it and then just tuck away the 'Twin Peaks' for another time.
Again. From my perspective...we're in nothing more than a simple 'Twin Peaks' topping formation and have never left.
You're finishing up the secondary peak now...
At the Turn...if the Pattern isn't breaking...you're dead wrong.
I've been watching the DAX(and the Nikkei) very closely. The reason is... with this apparent attempt at a new all time high on the DAX you're on the verge of breaking the pattern I outlined in my previous chart a week or two back. The CAC40 is still acting correctly, but the DAX...if it continues and can hold it. This is another place where you can also force a mea culpa from Ol' CoinGuy.
Although, It's not over...until it's over.
You know...I can remember the DAX having made a double top...and then a couple of years later it made another attempt at piercing that double peak just like it is today. Let's see...when was that? Right before the Pandemic Crash.
I have zero doubt it will repeat...
This time around, let's take a look at the CAC40 against our ol' favorite...BTC.
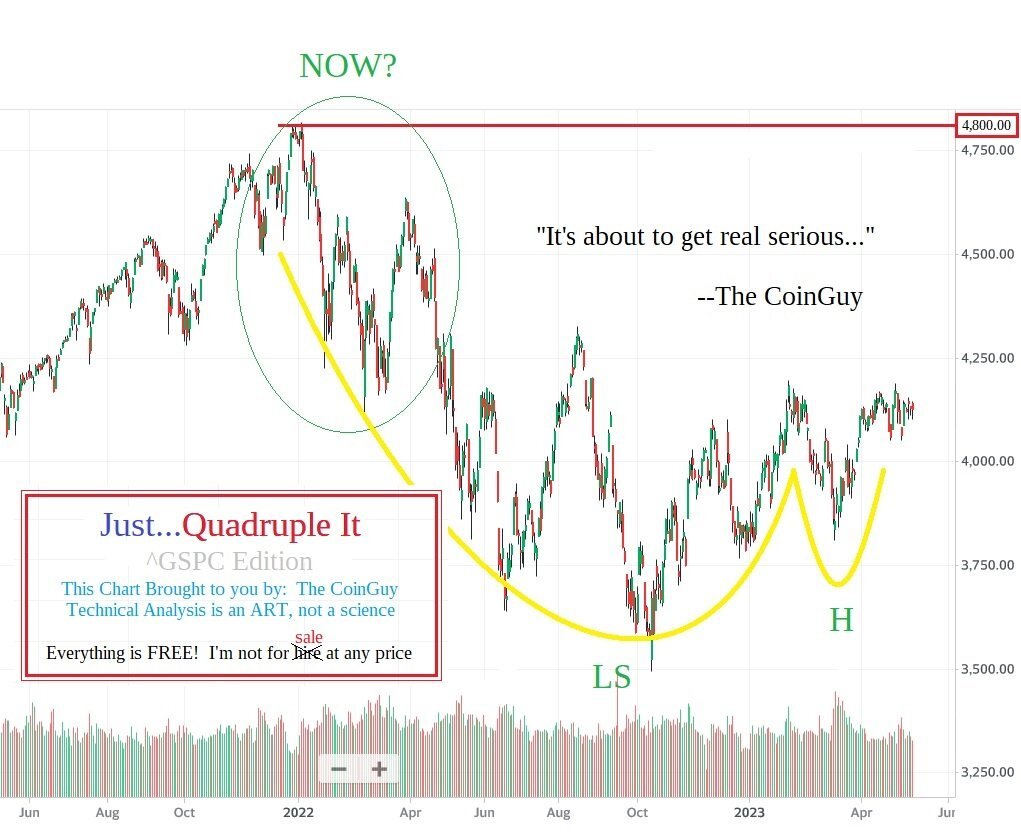
and then follow it up with...NOW?:
Since I mentioned the Nikkei, I'll add this. The ^N225 is dancing on the edge.
YOU may see the Nikkei...I see the DAX!
Ahh...The symmetry of a 'completed pattern'.
Then, we have that gap fill in the Nasdaq and as I've said many times. One day means nothing, it has to hold the area and on Volume.
Probing into a region, while it can be exciting...it has to hold the ground it just took.
If it can't? Simply put...it's over.
Same as the SPX, if the Nasdaq can pierce through and hold 13,200...I'll join you.
Why?
"Because that is the difference between a consolidation...and a continuation."
I can only hope that you take the time to think that through...
I'll close with this...
We've been treated to the 'appearance' of Gold & Silver trading inverse to the Stock Market since the October lows...nothing could be further from the truth.
Two Peas in a Pod:
Going forward from here. They will both continue to travel together until the magnet in the ^GSPC has been reached.
Then?
Blue Skies for one.
The other?
Green Shoots that eventually die of starvation(from lack of liquidity)...
"When you say you'll bail everyone out...the first test of that theory isn't far behind."
Best Regards,
The CoinGuy
oh...and...
For your convenience...
'Dust in the Wind' from the archives:
Being quick to anger is not good for the heart...or the soul.
Doc...
I'm known in my own little world as the "Philip K. Dick of Technical Analysis" so, I do appreciate the latest direction in your morning commentary.
To everyone else...
I re-posted(and then some) yesterday's tutorial...in yesterday's thread.
I'll apologize for the typo's...I didn't get to finish editing before the cut-off.
Gotta run...literally.
See you on Friday,
The CoinGuy
This Chart would not fit into the original post...
Although, the message it conveys is worthy of it's own post.
Can you start to see some symmetry in this chart? Can you find the center?
Do you remember this?
"As you Enter into the Formation...in the same Manner you Shall Leave".
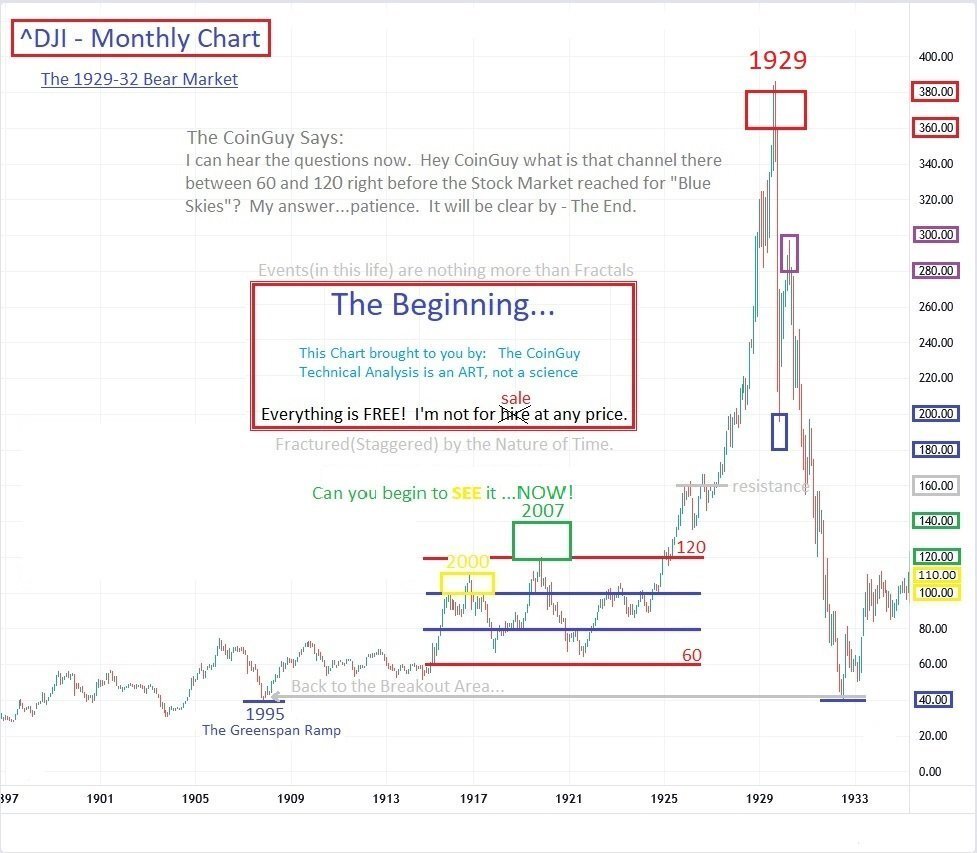
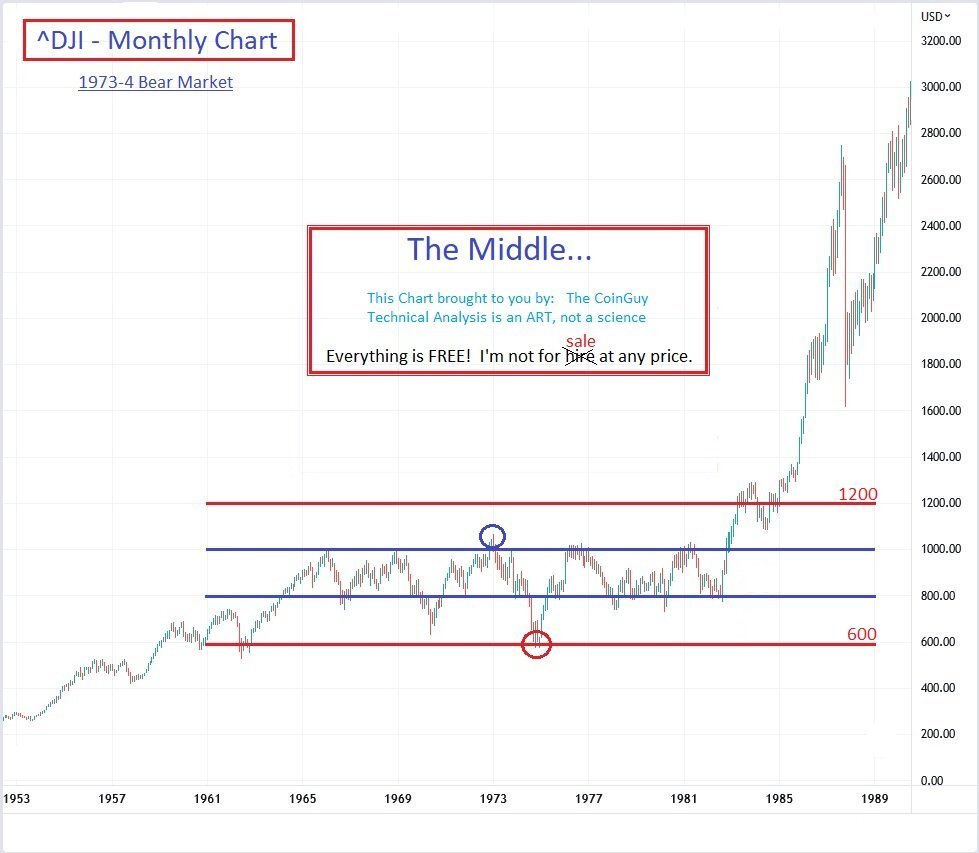
Once you study this for awhile and give it some serious thought...go back to "The Beginning...", "The Middle" and The End" and review them one more time.
Just remember when doing this...
NOT 1x - REST - 1x, but...10x - REST - 10x...
Best,
TCG
oh...and...
For your convenience...
The Beginning...
The Middle...
The End.
And maybe one or two more...smile. Think! Study! Never Give up!
the 'High Energy Advance"...
ditto...
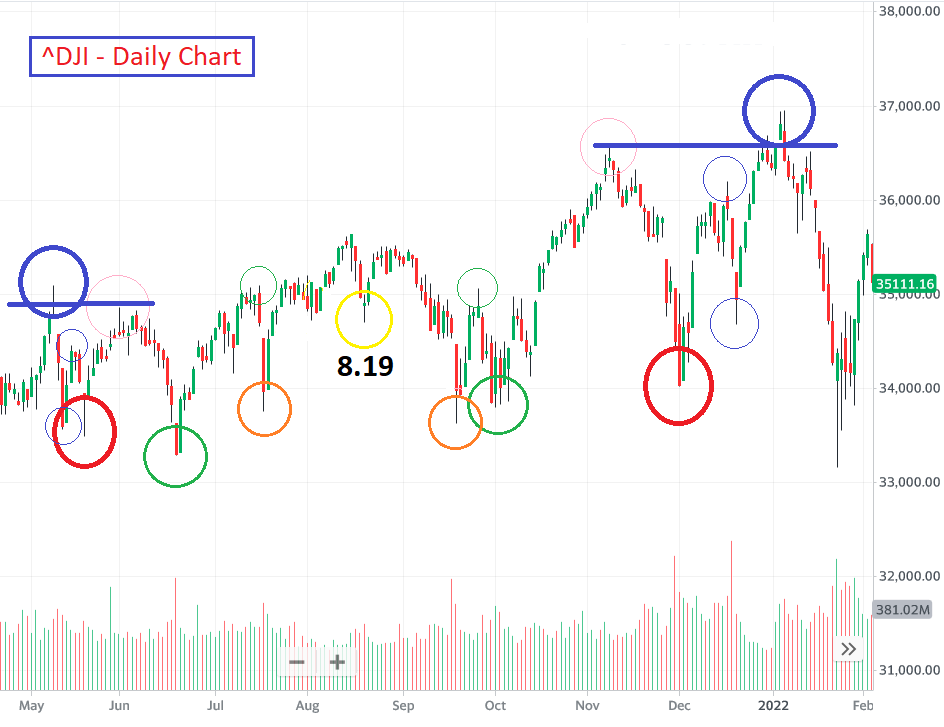
And to conclude. Perhaps...a re-post of the "Scratch Sheet"?
8.19? Hmm...didn't I see that recently somewhere else?
itiswhatitis...
Before I reply...I wanted to mention that it's good to see you posting. I see your name down there at the bottom quite often, but I don't recall you posting.
I'll apologize for removing the content. About a half hour after I posted I received a call about a relative. I'm heading out this morning and I won't be back until Thursday evening. I thought the 'tutorial' wasn't up long so...I'd remove it while I'm gone and just re-post it when I return.
Although, it appears as though someone is actually reading my material, so back up it goes. Like I've always said...I don't care if there is one man or a hundred. As long as someone is interested in learning...I'll continue to post.
I'm here to educate and lift up those who want to learn...
So...here we go:
I wrote this morning that 'as long as we don't take out the peak from February 2nd' my vote would be for nesting one's and two's.
Although, that thought comes with a caveat.
Always remember what Jesse espoused about markets...
"The market is designed to fool most of the people most of the time".
So...when I'm viewing the double top currently developing and I look at that pattern that has developed on the right hand side...I searched through my archives and could not find a single instance where that pattern was a peak. It was usually a continuation, a 2nd or 4th wave consolidation pattern...where you would have one more push - to completion(5th wave).
Perhaps, a push...to dishearten the bears...and lend confidence to the bulls?
Well...for now...I'll just enter a few of my own quotes.
"I'll judge today, by what I see tomorrow."
"One day does not a new trend make."
"Patience Pays".
Don't fall for any nonsense being the main point. Let's see the whites of their eyes before putting pressure on the trigger.
Now...the caveat to the caveat. Smile. The left peak in '08 was the high. The right peak just rolled over...
Smile...
Moving on...
I recently posted this chart of the nesting peaks & valleys in the ^HUI. This pattern isn't all that common, but when it appears...well, as I said that day...it ends in tears. If you think you've identified a nesting cup at a bottom and you're watching the market advance...start watching the advance and keep your eyes open for a 'halfway marker' of some sort. The market will always give you one. Later on...when we're discussing measuring from the center to the outside, I'll help you take advantage of that information. Until then. NOTE THE DATE! A pattern. Will. Unfold.
What do you mean a pattern will unfold? What do you think I'm teaching here, pie in the sky nonsense? Smile. I've spent a great deal of time showing you pattern after pattern in the stock market have I not? Don't you think there would also be a 'pattern in Time'? Huh? What? Smile.
Pay attention to the dates I post. There is not a single date that I post that doesn't have HUGE significance to the Stock Market - In. A. Repetitive. Manner.
I'll ask...Can you begin to SEE it?
There's that pesky 19.20 again...
Here I am a staunch and I do mean staunch 110% backer of all things Gold...and you wouldn't believe how many enemies in that sector I made when I came in back at the 2011 peak(which was 640 in the ^HUI.) with my 'The 610 train to Nowhere Speech'...or my 2008 call in silver at 19.20. The names I was called...well...it was an interesting experience.
On both occasions...from hero to outcast...in 30 seconds flat.
640 time 3 is?
Now, when I kept repeating over and over after the June 8th peak in the ^XOI(see: Life IS a Symphony in the archives) that there were serious advantages to paying close attention to this sector...it didn't draw much attention. Well, that didn't prevent me from taking a little slice for myself.
Now, as this opportunity comes to a close...if anyone on the forum is still hanging around you might want to move along before you become a statistic...
You could walk over to oil, where there is still something worthy to look at(two charts down), but frankly...there are better opportunities lining up in the market itself(next chart).
From my perspective...it's your best opportunity. Although, I live by rules...and one of them is. To each his own...
When you view the Rev H&S, please hear my words. "Other's might be looking for continuation...I'm looking for inversion".
And here is that brief look at oil...
Before I discuss bonds...I'm going to add this comment that wasn't in the original post, but is more and more finding it's way to forefront of my thoughts.
I never mince words or sit on a fence and I always take full responsibility for my actions. I also try to be very direct in my manner of speech when bringing forth an idea...
Going Forward
"If the Stock Market doesn't recoil at the 2,240 to 2,250 MAGNET. Then...THAT is your signal that you're getting it ALL dumped into your lap right now. AND...the target will be according to the Rule of 19.20!"
"The only thing that can override the Rule of 19.20 IS the MAGNET."
Keep one eye on that 50% level from the January 2022 peak. Tweet Tweet...it'll be your canary.
2,240 to 2,250 is the dividing line between a one-stage and two-stage decline. To keep that picture simple...
The difference between a repeat of '08...and...'29.
Can you really begin to SEE it?
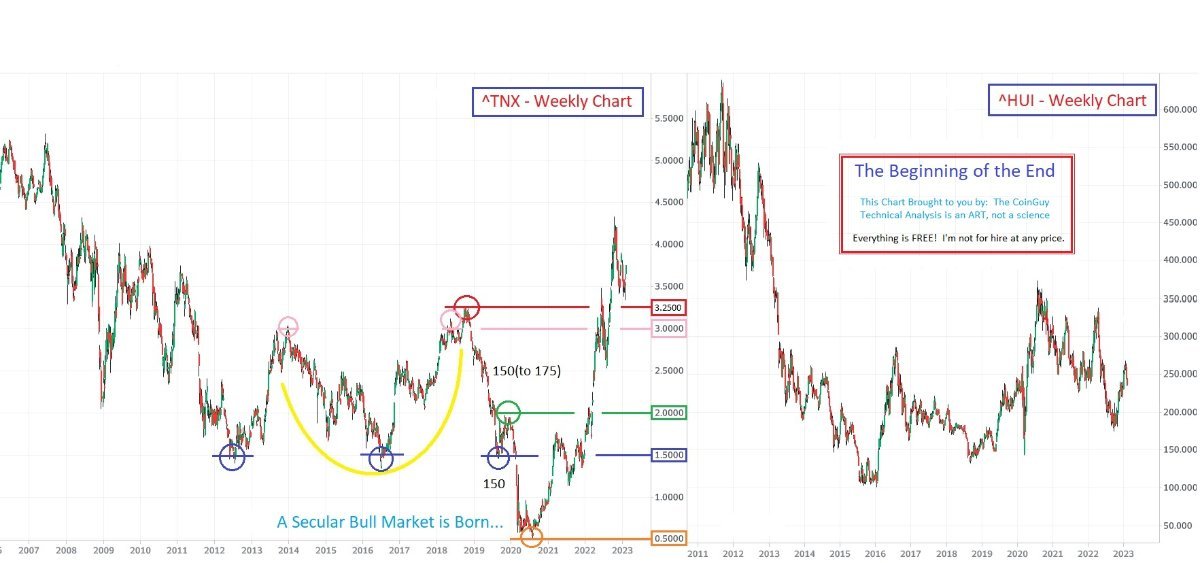
Bonds
My assistant and bond guy Tom asked me twice this week my thoughts on bonds. I can tell he's interested here, so I did take a look at the charts. I poured over them for quite some time. I'm going to go ahead...after the ball gets rolling...and post a chart(or three) on the bond market, then refrain from any further comments on bonds going forward - unless absolutely necessary. The simple reason is...I do not like bonds. Since the early 90's, well...MBS and some other practices...I just don't like them. I don't like insurance either. Can you guess what type of firm my father owned? One or the other? Or...I'm well versed...in both?
At any rate, I've already lined up what I want to convey in the chart. I'll just need a little time. I do believe once you view my chart(s) you won't need any other information for quite some time.
If you review my UUP charts, or any charts mentioning HE(High Energy) events in the archives...the chart I post won't come as much of a shock....
Take Care All, as long as everything goes well...I shall see you on Friday.
The CoinGuy
"Each student had to only overcome disbelief...in themselves."
Every Gold Star recipient will receive a bonus chart from yours truly. No one gets passed by…
This chart below is for FTW, who recently forced ol’ CoinGuy to do a double-take with one of his answers to my questions.
His reply was THAT good.
I’m not joking when I say...I had to pull the chart up from my Archives and verify the answer was correct.
Congratulations. Because you sir...nailed it.
Here is:
Be Water My Friend
Wave Pattern Distortion. 250.
Think it through...
Best Regards,
The CoinGuy
To Dream the Impossible Dream
Good morning...
I would encourage you to never settle for 'Life As It Is'.
Ok...onto the business at hand.
This is what I like to call a review chart. Why? Because we're reviewing a few concepts already brought to the table before I build on this foundation in the next chapter.
Really give 52.50 some serious thought. Back when I was studying charts, we'd pour over them for hours, days...weeks. When our brains were melting from overload...we'd cover our ears with duct tape and keep going.
Let the other guy rely on someone for a fundamental 'narrative' of assumptions...you go directly to the source.
Fractals...within Time:
Here a little...there a little...until it ALL comes into view.
Well...
Back to...Man of La Mancha.
Can be had for less than 5 bucks on ebay...
TCG
I've been watching the XOI rather closely. Although...I felt too closely...I had to revise the BIM 3 times!
It seems....the whole world is sitting on some pretty thin support(lines).
If you read my scratch sheets. The one month cycle on the 13th(sometimes 14th) is what I was watching as a possible turn.
So...hopefully next week offers us something worth looking at...
I'll offer this up because I am watching it...
The first peak in the ^DJI at the all time high was on 11.08 in 2021. The peak in the ^IXIC was on 11.22. 11.15 can sometimes be a pivot...or a turning point. If you've been paying attention it's also 40 days from 10.06...and 40 days from Xmas. There's more, but you get the idea.
And the opposite part of the year is...Monday.
Who knows...we'll see how it goes. Could be nothing.
Historically, in May...the 19th through the 22nd, and the 31st can also be important days.
Everyone have a good weekend...
TCG
Ok...
Let me pull out my little black book and grab my LAMY Safari fountain pen...
WTF, Gold Star...
Two 'correct' observations. One...borderline astute.
TCG